


Market Analysis: AUD/USD and NZD/USD Flash Early Signs of Bullish Recovery
FXOpen

AUD/USD is attempting a fresh increase from 0.7115. NZD/USD is consolidating and could aim for a move above 0.5930 in the short term.
Important Takeaways for AUD/USD and NZD/USD Analysis Today
• The Aussie Dollar remained supported above 0.7100 and recovered losses against the US Dollar.
• There is a rising channel forming with resistance at 0.7200 on the hourly chart of AUD/USD at FXOpen.
• NZD/USD is consolidating gains above 0.5900 and 0.5890.
• There is a bullish trend line forming with support at 0.5890 on the hourly chart of NZD/USD at FXOpen.
AUD/USD Technical Analysis
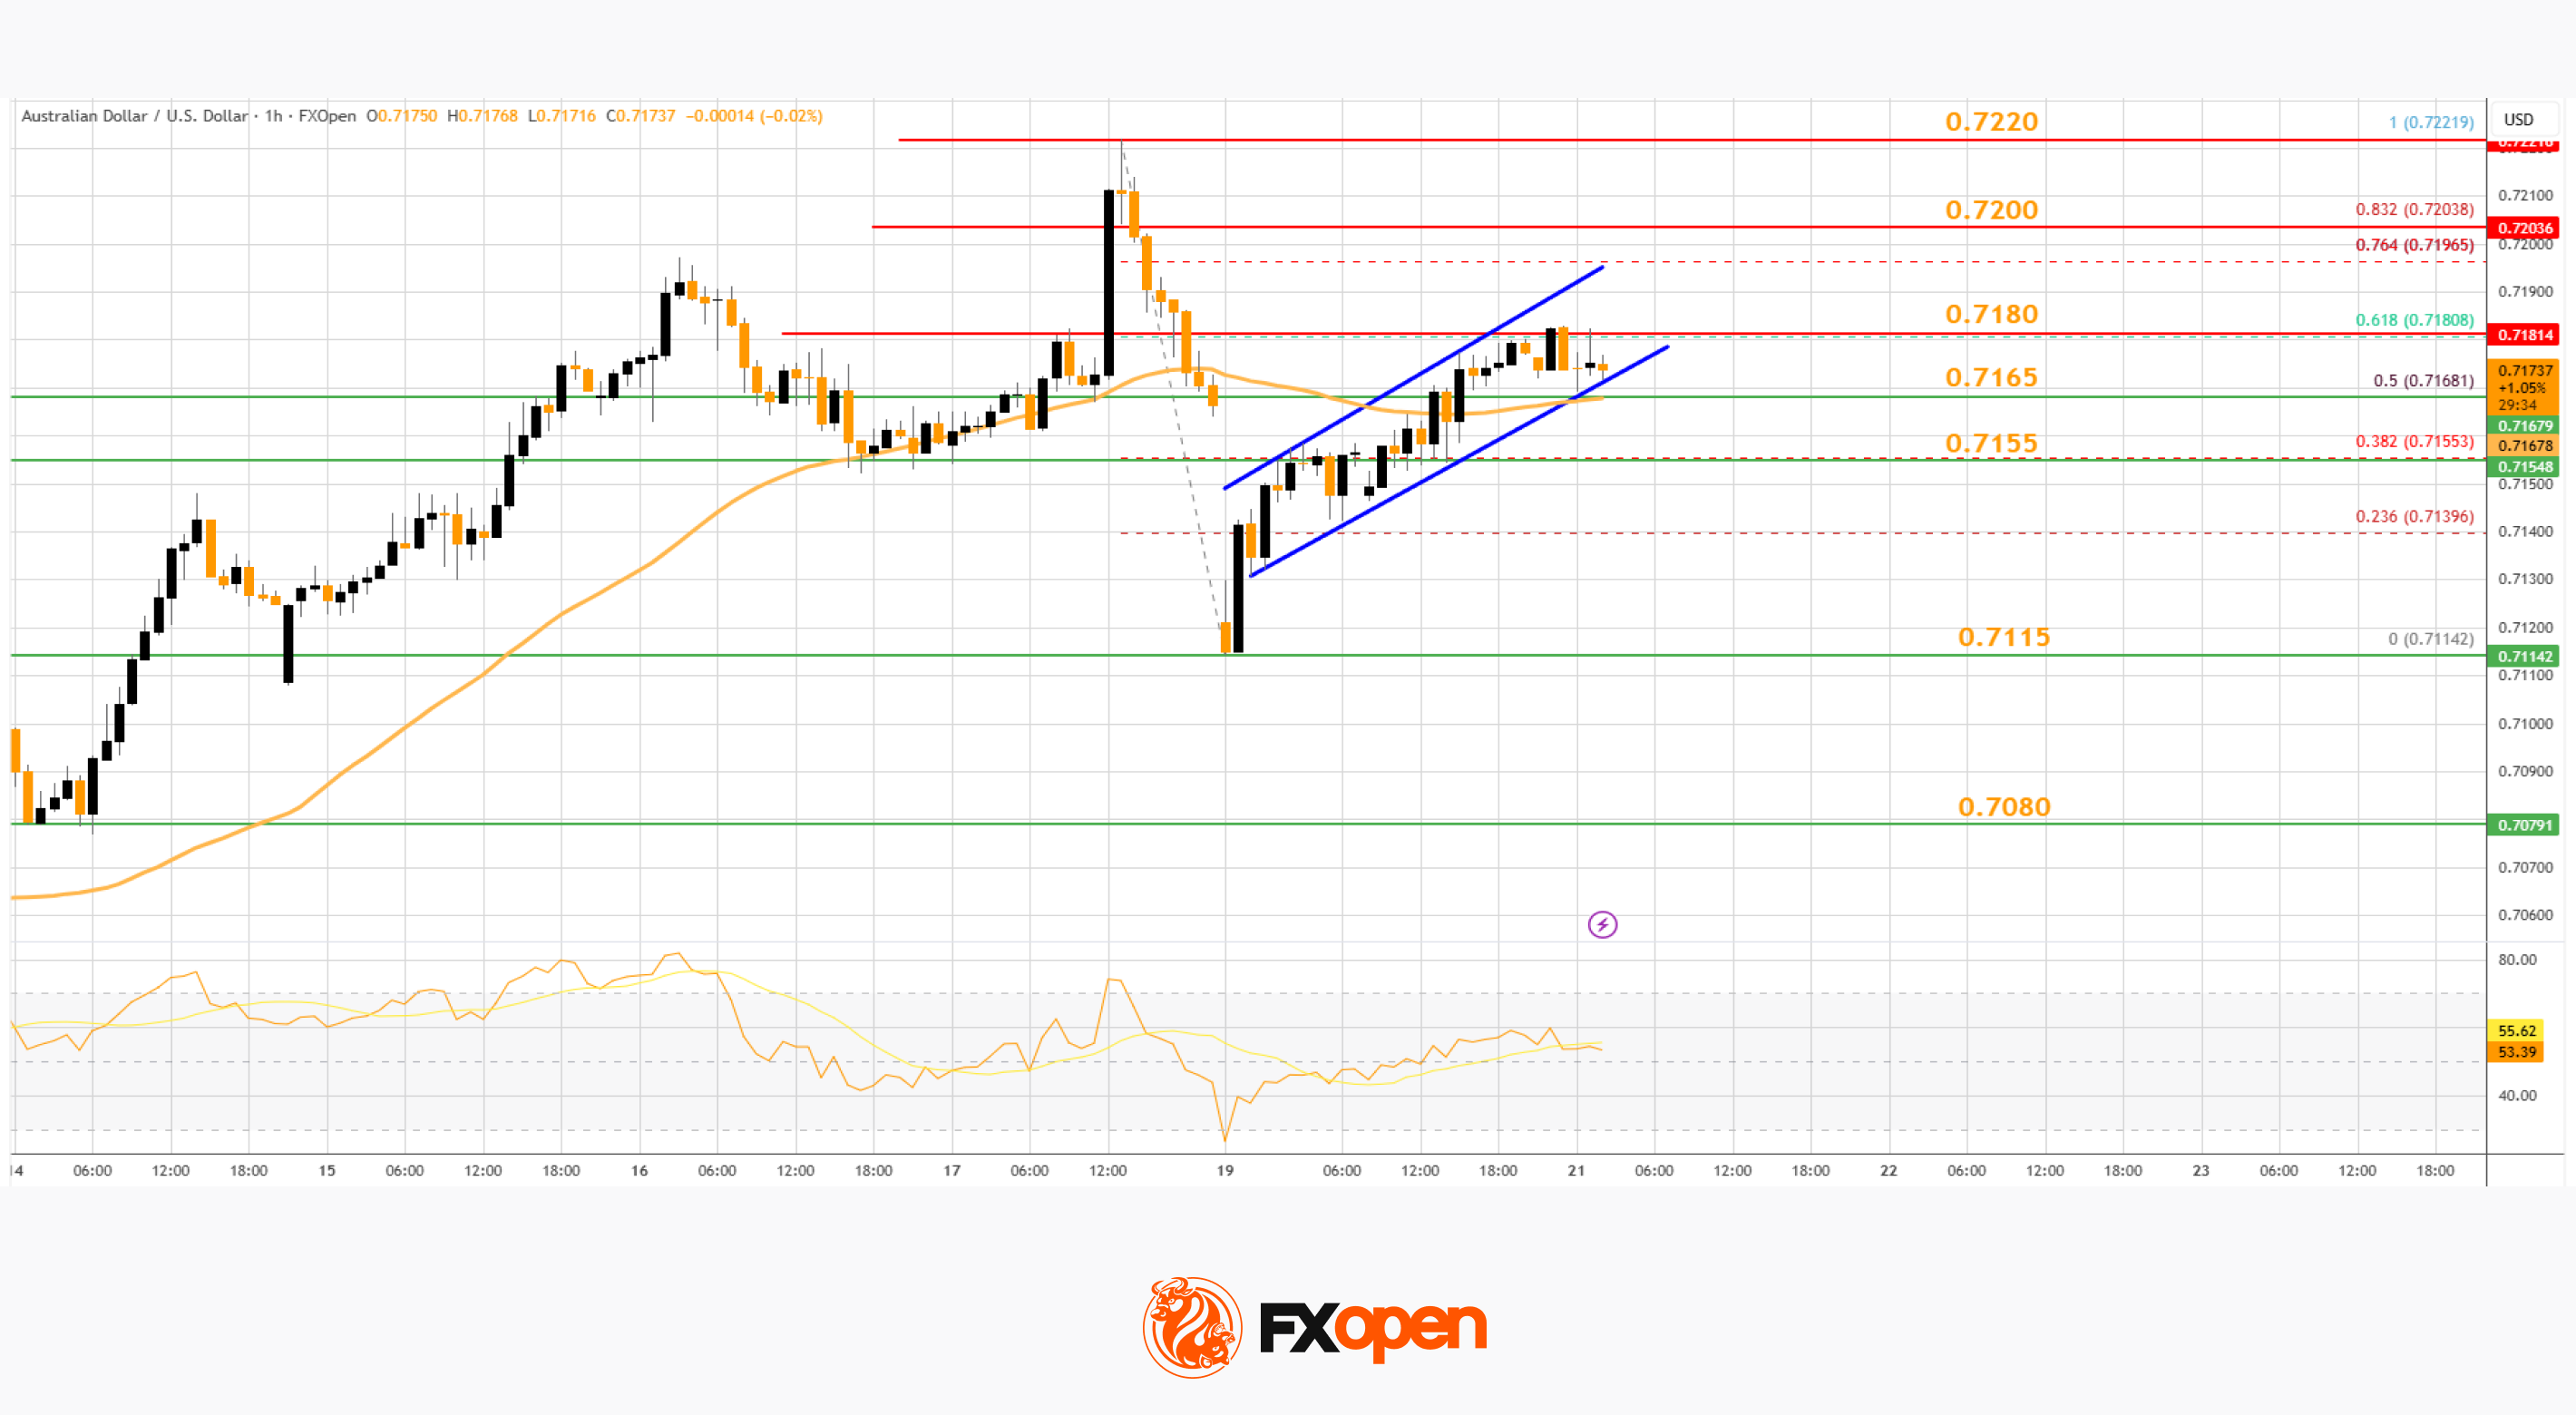
On the hourly chart of AUD/USD at FXOpen, the pair formed a base above 0.7100. The Aussie Dollar started a decent increase above 0.7150 against the US Dollar to enter a short-term positive zone.
The bulls even pushed the pair above the 50% Fib retracement level of the downward move from the 0.7221 swing high to the 0.7114 low and the 50-hour simple moving average. The AUD/USD chart indicates that the pair could struggle to clear the 61.8% Fib retracement at 0.7180.
The first major hurdle for the bulls could be 0.7200. There is also a rising channel forming with resistance at 0.7200. An upside break above 0.7200 might send the pair further higher. The next major target might be 0.7220.
Any more gains could clear the path for a move toward 0.7300. If there is no close above 0.7200, the pair might start a fresh decline. Immediate bid zone could be near 0.7165 and the 50-hour simple moving average.
The next area of interest is 0.7155. If there is a downside break below 0.7155, the pair could extend its decline toward 0.7115. Any more losses might signal a move toward 0.7080.
NZD/USD Technical Analysis
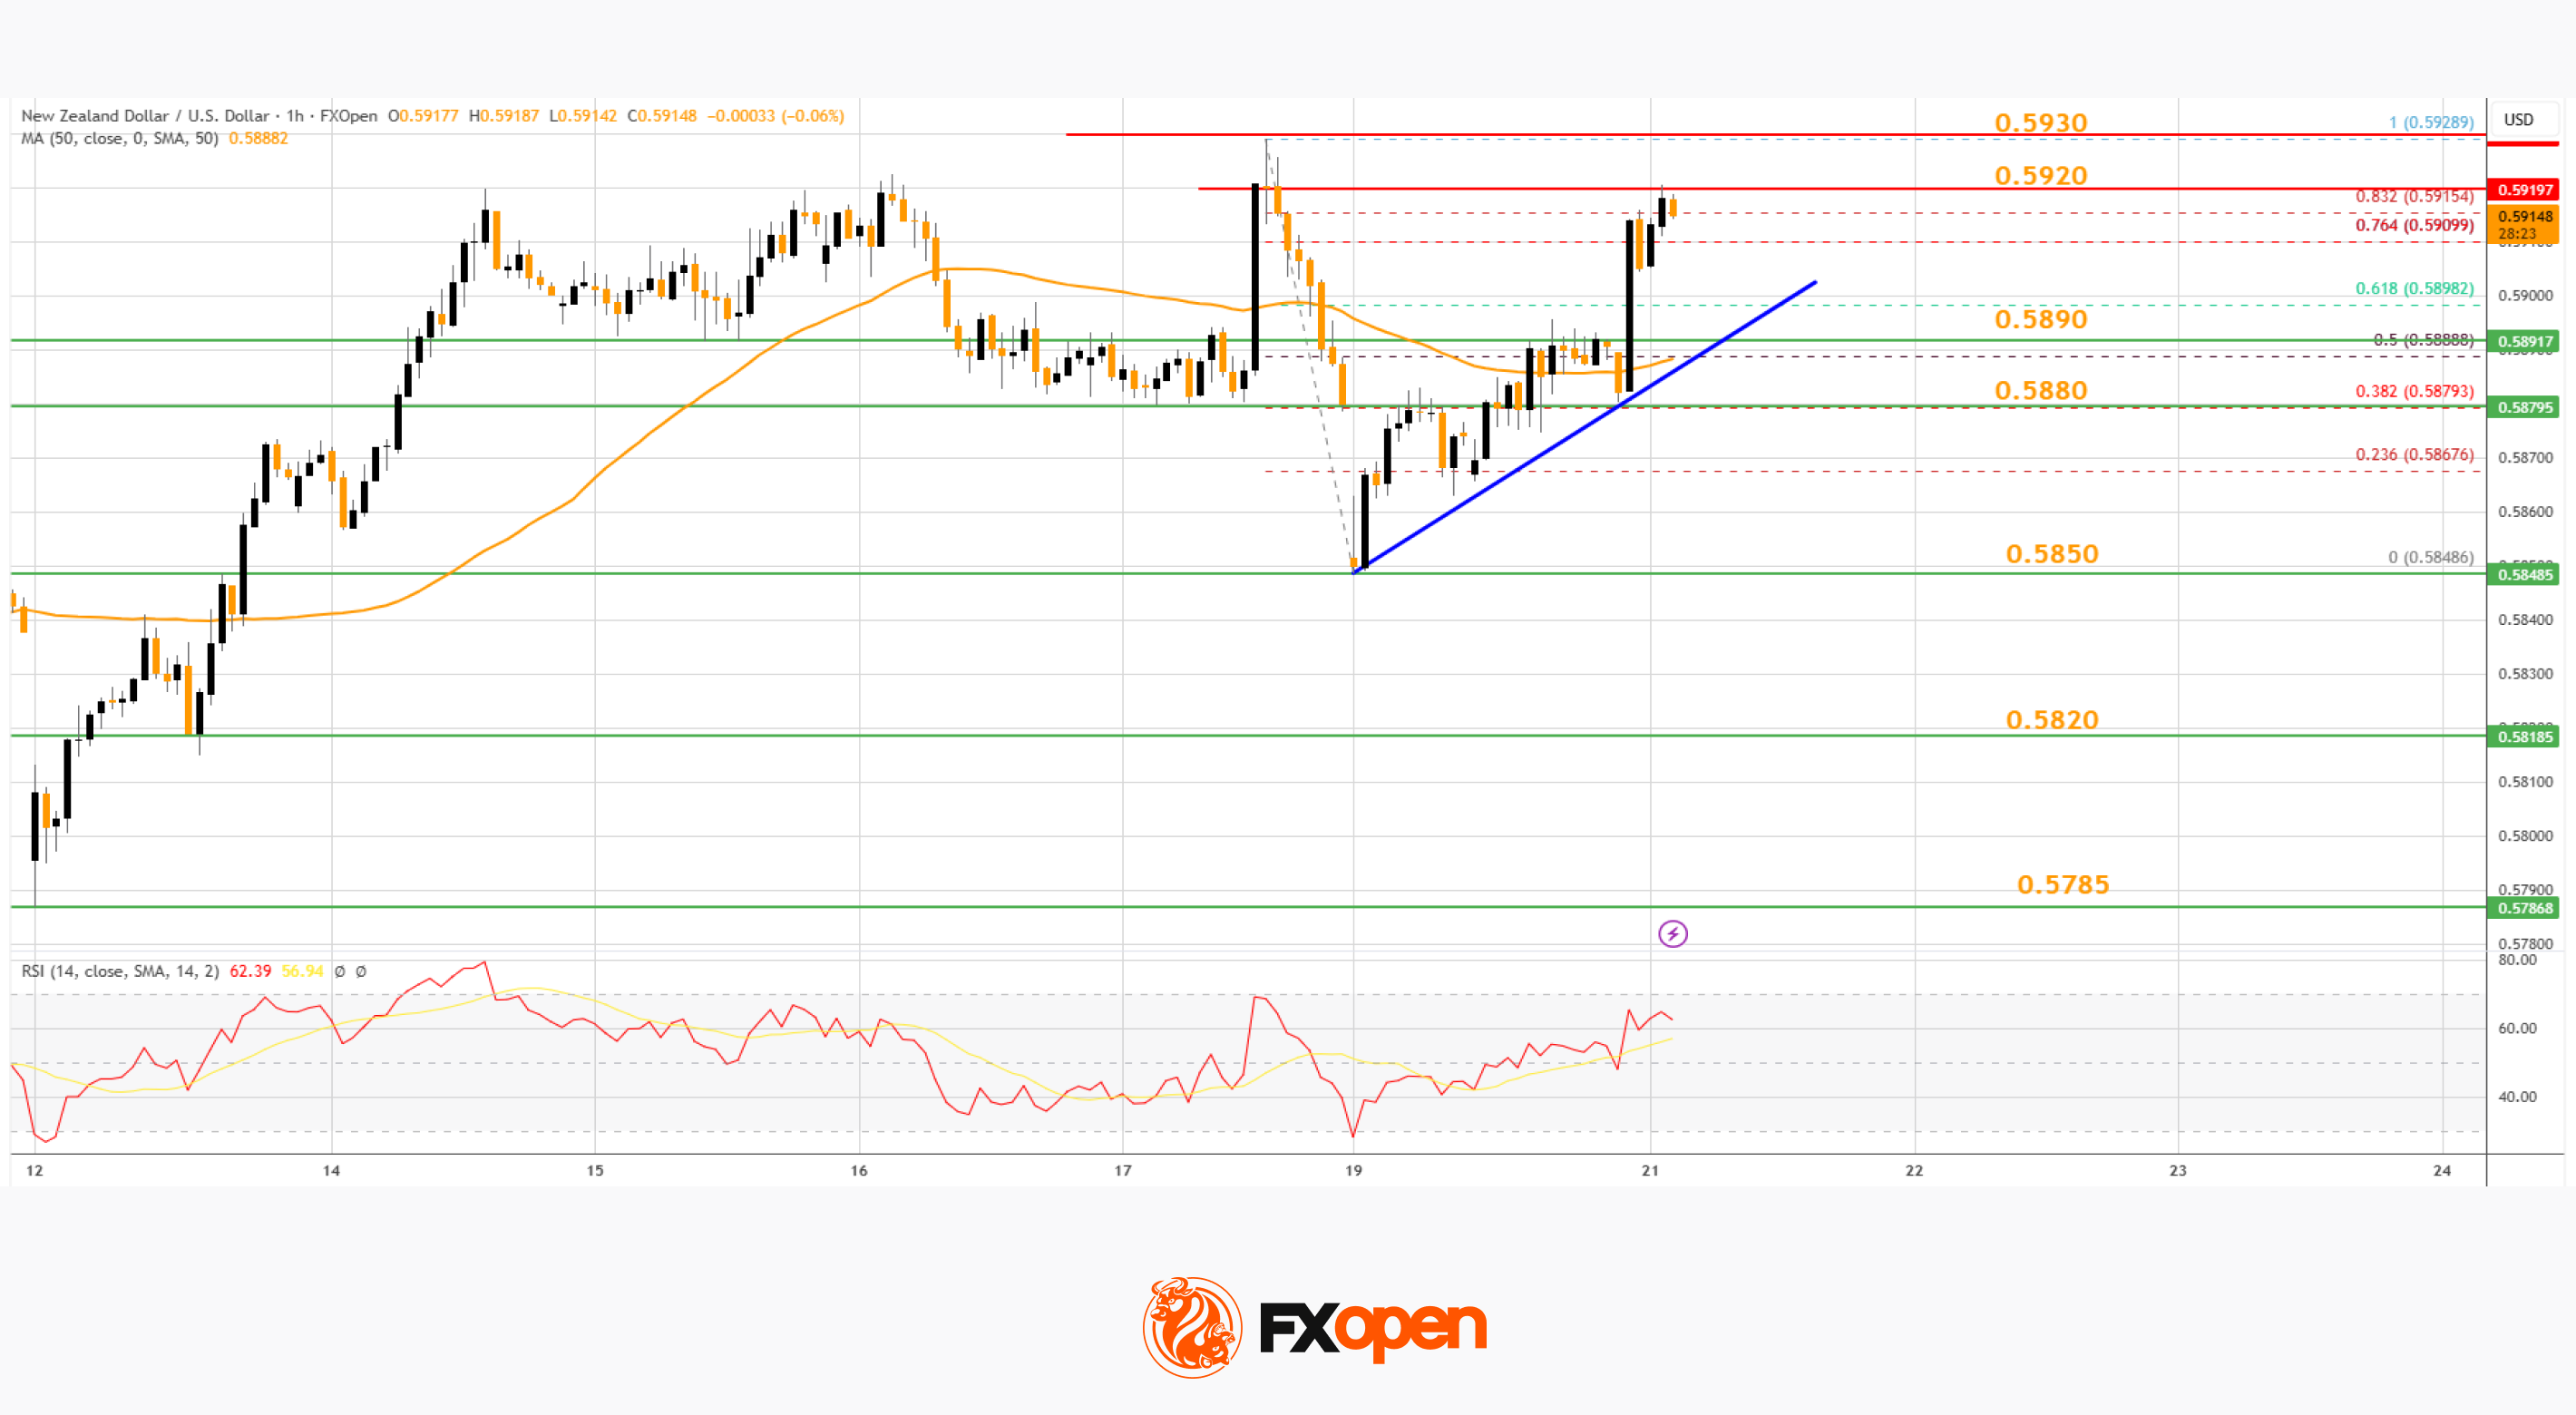
On the hourly chart of NZD/USD on FXOpen, the pair also followed AUD/USD. The New Zealand Dollar failed to stay above 0.5920 and corrected gains against the US Dollar.
The pair dipped below 0.5900 and the 50-hour simple moving average. A low was formed at 0.5848, and the pair is now attempting to recover losses. There was a move above the 50% Fib retracement level of the downward move from the 0.5928 swing high to the 0.5848 low.
Besides, there is a bullish trend line forming with support at 0.5890. The NZD/USD chart suggests that the RSI is above 50, signaling a short-term positive bias. On the upside, the pair is facing resistance near 0.5920.
The next major hurdle for buyers could be near 0.5930. A clear move above 0.5930 might even push the pair toward 0.5950. Any more gains might clear the path for a move toward the 0.6000 pivot zone in the coming sessions.
On the downside, there is support forming near 0.5890 and the 50-hour simple moving average. If there is a downside break below 0.5890, the pair might slide toward 0.5850. Any more losses could lead NZD/USD into a bearish zone to 0.5820.
Trade over 50 forex markets 24 hours a day with FXOpen. Take advantage of low commissions, deep liquidity, and spreads from 0.0 pips (additional fees may apply). Open your FXOpen account now or learn more about trading forex with FXOpen.
This article represents the opinion of the Companies operating under the FXOpen brand only. It is not to be construed as an offer, solicitation, or recommendation with respect to products and services provided by the Companies operating under the FXOpen brand, nor is it to be considered financial advice.
Stay ahead of the market!
Subscribe now to our mailing list and receive the latest market news and insights delivered directly to your inbox.


Latest articles

EUR/USD Analysis: Who Is in Control?
Two central banks, two hawkish tones — but only one dollar just took a hit. The ECB delivered a 25bp hike in June, its first since 2023, lifting the deposit rate to 2.25% as Middle East-driven energy costs pushed headline

Gold Resumes Its Advance Following the US Labour Market Report
Gold is attempting to break its medium-term trend, with the latest US labour market data acting as the main catalyst. The US employment report released on 2 July came in noticeably weaker than expected, with the pace of hiring slowing

NZD/CHF Analysis: Which Currency Breaks the Consolidation First?
NZD/CHF remains locked in a tight range as traders await the next monetary policy catalyst.
The Reserve Bank of New Zealand heads into Wednesday's meeting on shaky ground. After May's 3-3 split was resolved by a casting vote, the