


FXOpen

AUD/USD is gaining pace and recently cleared 0.6600. NZD/USD is also rising and could extend its increase above the 0.6200 resistance zone.
Important Takeaways for AUD/USD and NZD/USD Analysis Today
- The Aussie Dollar is moving higher from the 0.6480 zone against the US Dollar.
- A connecting bullish trend line is forming with support at 0.6615 on the hourly chart of AUD/USD at FXOpen.
- NZD/USD is gaining pace above the 0.6155 support.
- A key bullish trend line is forming with support at 0.6170 on the hourly chart of NZD/USD at FXOpen.
AUD/USD Technical Analysis
On the hourly chart of AUD/USD at FXOpen, the pair formed a base above 0.6480, as discussed in the previous analysis. The Aussie Dollar gained strong bids and started a decent increase above the 0.6540 resistance against the US Dollar.
The bulls pushed the pair above the 0.6580 resistance zone. There was a close above the 0.6600 resistance and the 50-hour simple moving average. Finally, the pair tested the 0.6635 zone. A high is formed at 0.6633 and the pair is now consolidating above 23.6% Fib retracement level of the upward move from the 0.6477 swing low to the 0.6633 high.
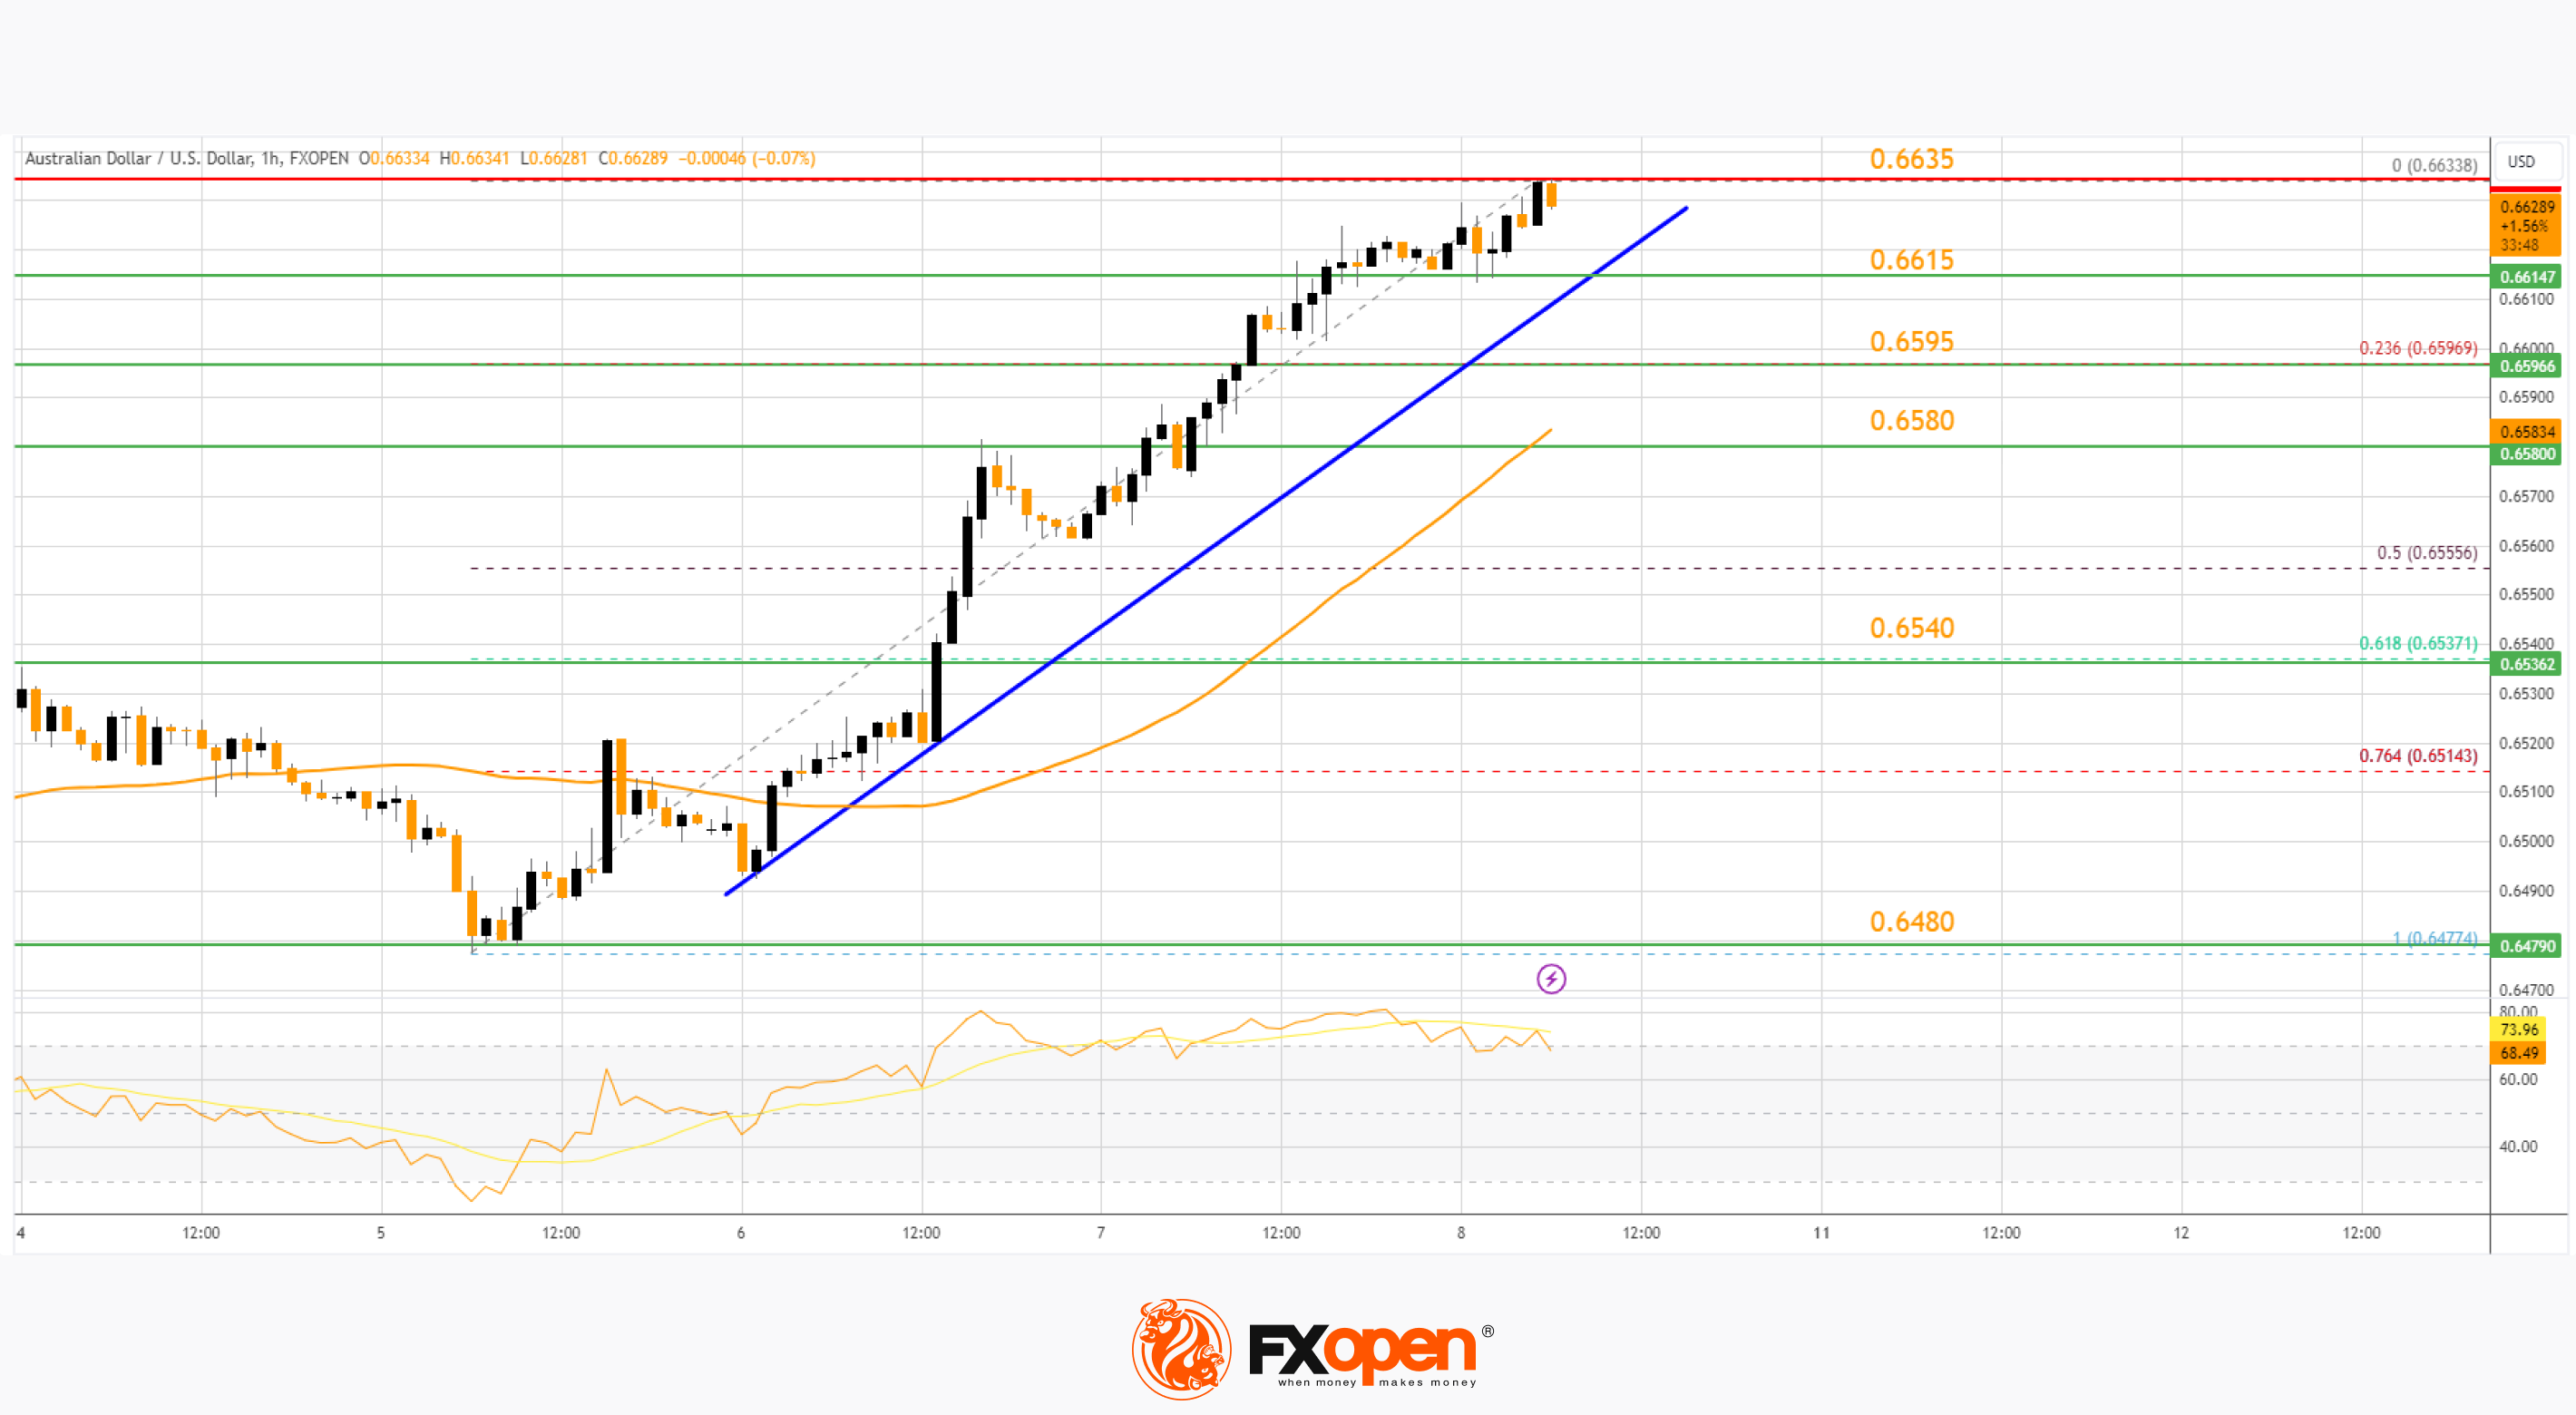
On the upside, the AUD/USD chart indicates that the pair is now facing resistance near 0.6635. The first major resistance might be 0.6650. An upside break above the 0.6650 resistance might send the pair further higher.
The next major resistance is near the 0.6720 level. Any more gains could clear the path for a move toward the 0.6800 resistance zone.
If not, the pair might correct lower. Immediate support is near a connecting bullish trend line at 0.6615. The next support could be 0.6595. If there is a downside break below the 0.6595 support, the pair could extend its decline toward the 0.6580 zone.
Any more losses might signal a move toward the 61.8% Fib retracement level of the upward move from the 0.6477 swing low to the 0.6633 high at 0.6540.
NZD/USD Technical Analysis
On the hourly chart of NZD/USD on FXOpen, the pair followed AUD/USD. The New Zealand Dollar formed a base above the 0.6070 level and started a decent increase against the US Dollar.
The pair climbed above the 0.6125 resistance and the 50-hour simple moving average. The pair even spiked above 0.6180. A high is formed near 0.6183 and the pair is now consolidating gains.
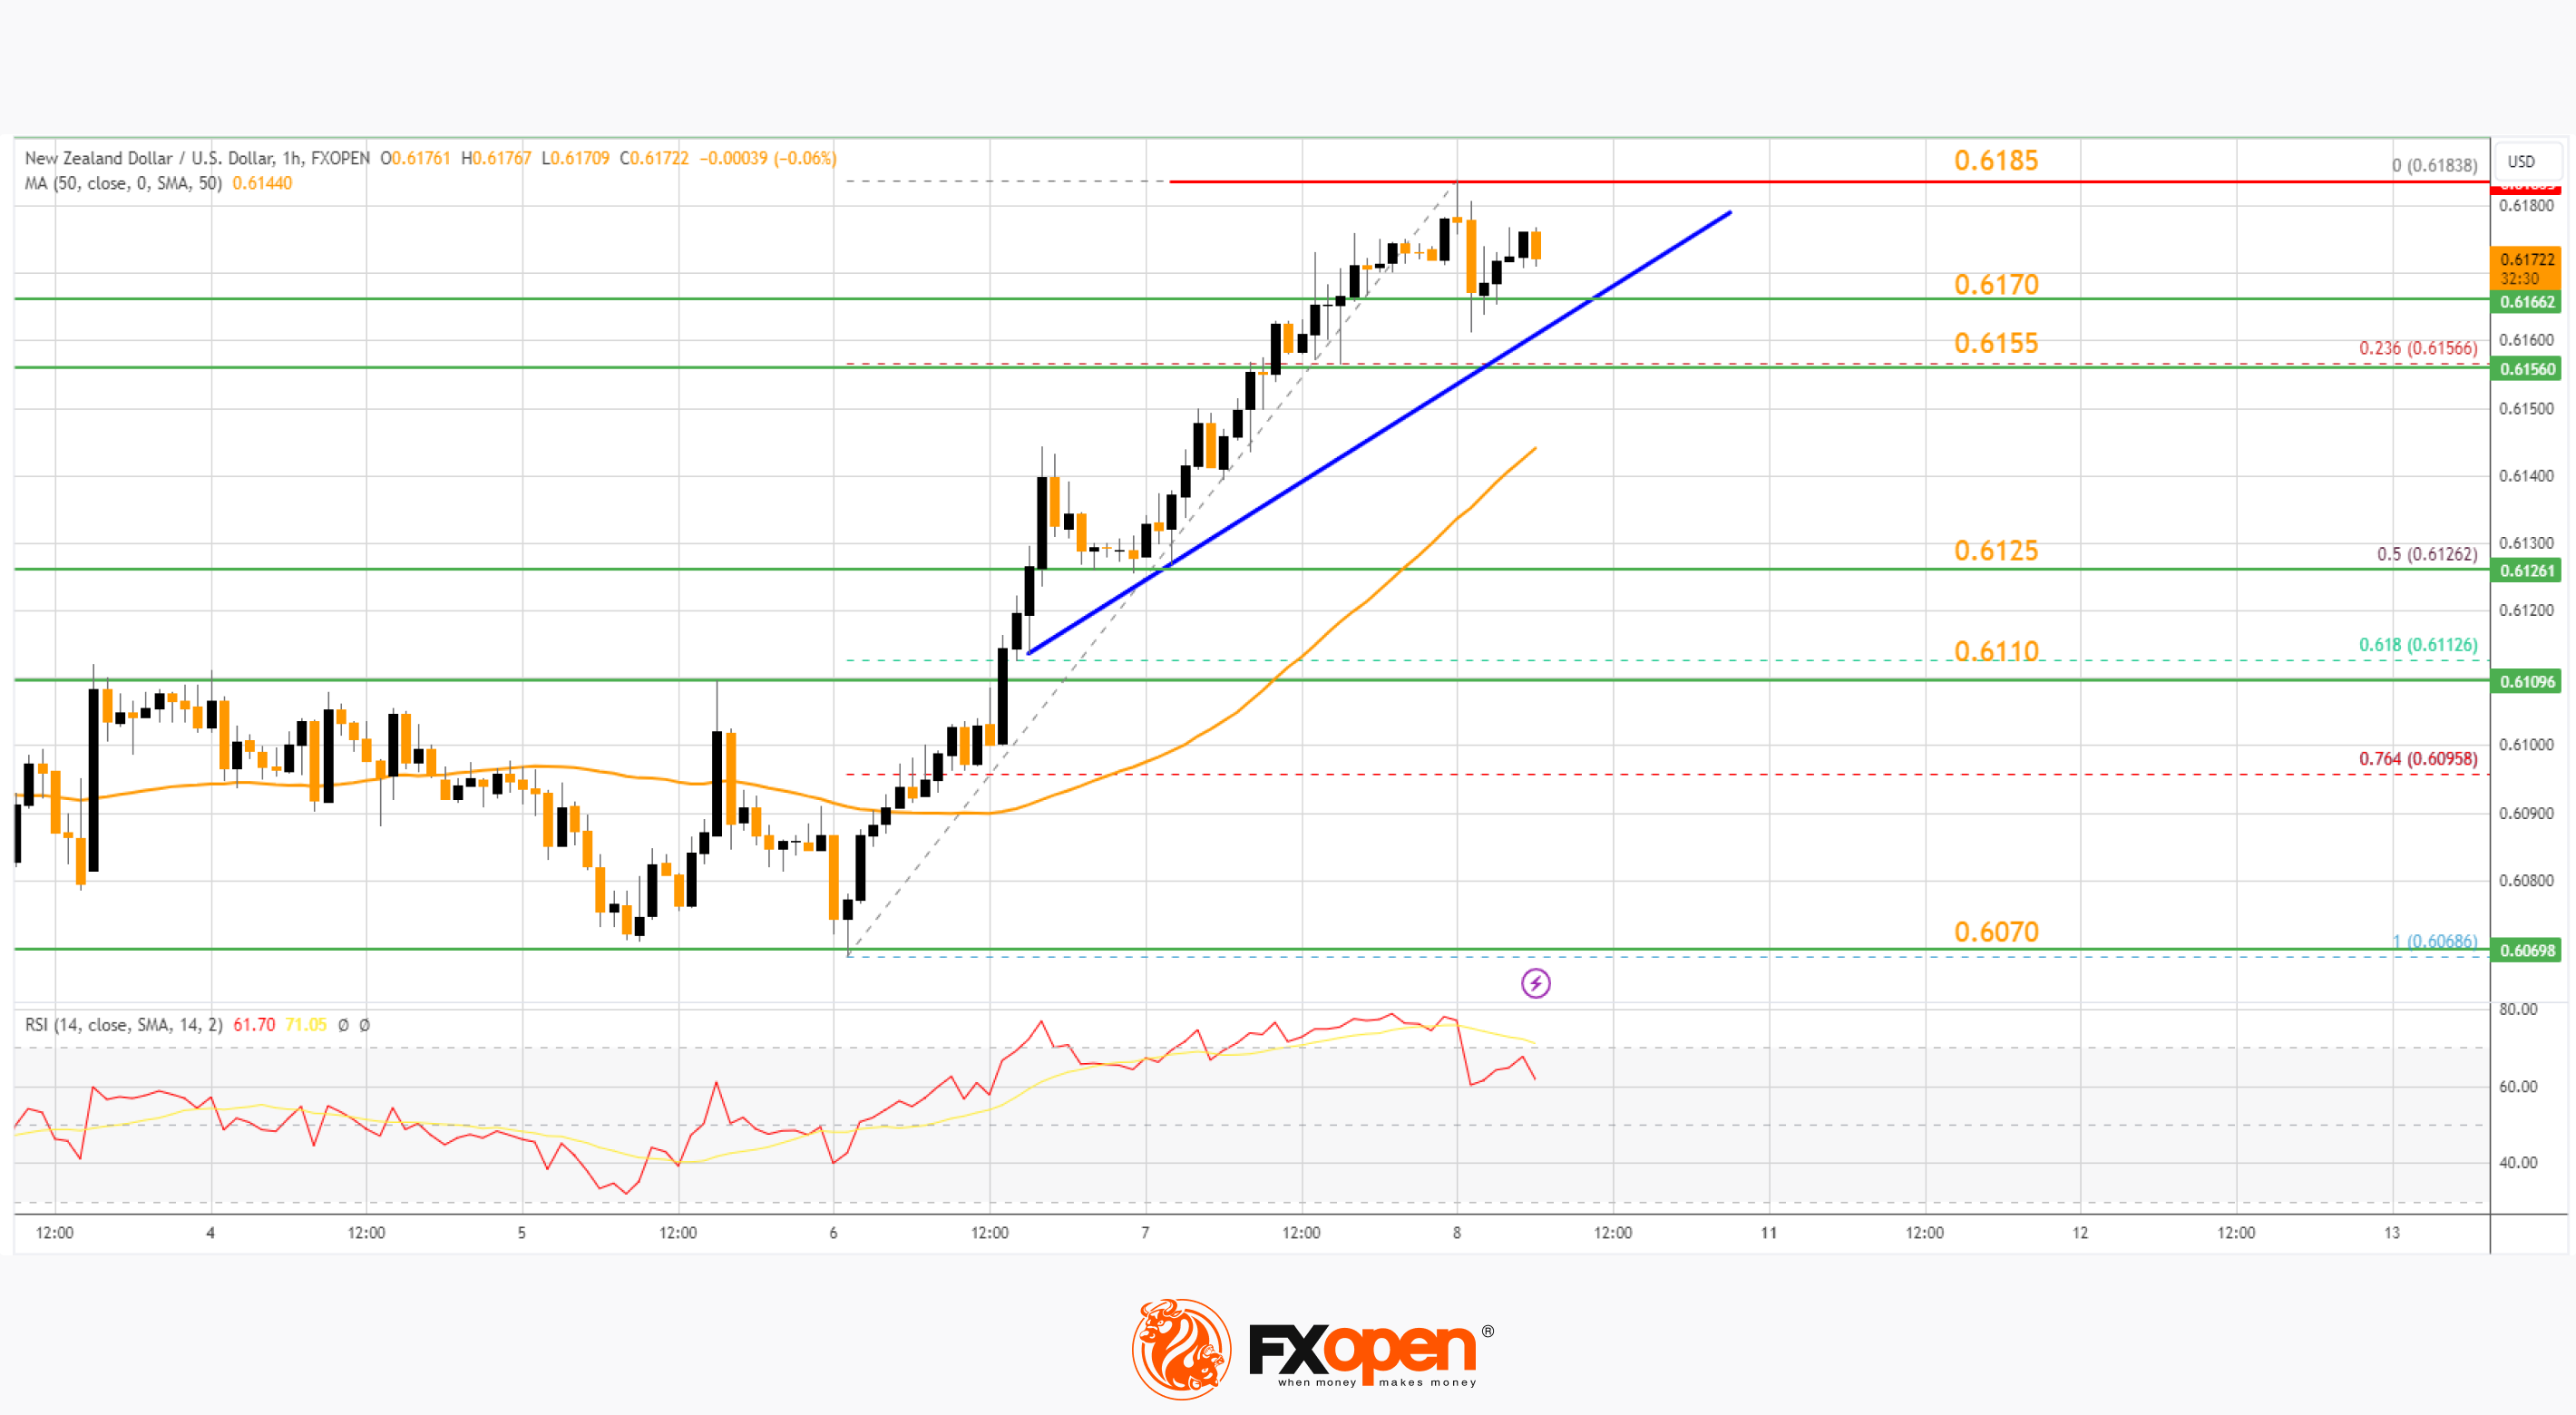
On the upside, the pair is facing resistance near the 0.6185 zone. The NZD/USD chart suggests that the RSI is stable above 50. The next major resistance is near the 0.6200 level. A clear move above 0.6200 might even push the pair toward the 0.6250 level.
Any more gains might clear the path for a move toward the 0.6320 resistance zone in the coming days. On the downside, there is a support forming near 0.6170. There is also a bullish trend line forming with support at 0.6170.
The next major support is 0.6155 or the 23.6% Fib retracement level of the upward move from the 0.6068 swing low to the 0.6183 high. If there is a downside break below the 0.6155 support, the pair might slide towards 0.6125.
The 50% Fib retracement level of the upward move from the 0.6068 swing low to the 0.6183 high is also at 0.6125. Any more losses could lead NZD/USD in a bearish zone to 0.6070.
Trade over 50 forex markets 24 hours a day with FXOpen. Take advantage of low commissions, deep liquidity, and spreads from 0.0 pips (additional fees may apply). Open your FXOpen account now or learn more about trading forex with FXOpen.
This article represents the opinion of the Companies operating under the FXOpen brand only. It is not to be construed as an offer, solicitation, or recommendation with respect to products and services provided by the Companies operating under the FXOpen brand, nor is it to be considered financial advice.
Stay ahead of the market!
Subscribe now to our mailing list and receive the latest market news and insights delivered directly to your inbox.


Latest articles

Market Analysis: GBP/USD Dips Further As EUR/GBP Regains Traction
GBP/USD failed to climb above 1.3500 and corrected some gains. EUR/GBP started a decent increase and might aim for more gains above 0.8700.
Important Takeaways for GBP/USD and EUR/GBP Analysis Today
· The British Pound


Market Insights with Gary Thomson: Oil, US Retail Sales & NFP in Focus
In this video, we’ll explore the key economic events and market trends, shaping the financial landscape. Get ready for insights into financial markets to help you navigate the week ahead. Let’s dive in!
In this episode of Market