


FXOpen

AUD/USD failed to stay in a positive zone and declined below 0.7000. NZD/USD is also moving lower and might extend losses below 0.5850.
Important Takeaways for AUD/USD and NZD/USD Analysis Today
· The Aussie Dollar started a fresh decline from well above 0.7100 against the US Dollar.
· There is a bearish trend line forming with resistance at 0.7020 on the hourly chart of AUD/USD at FXOpen.
· NZD/USD declined steadily from 0.6000 and traded below 0.5900.
· There is a key bearish trend line forming with resistance at 0.5900 on the hourly chart of NZD/USD at FXOpen.
AUD/USD Technical Analysis
On the hourly chart of AUD/USD at FXOpen, the pair struggled to clear 0.7150. The Aussie Dollar started a fresh decline below 0.7050 against the US Dollar.
The pair even settled below 0.7000 and the 50-hour simple moving average. There was a clear move below 0.6980. A low was formed at 0.6956, and the pair is now consolidating losses. There was a minor recovery wave above the 23.6% Fib retracement level of the downward move from the 0.7089 swing high to the 0.6956 low.
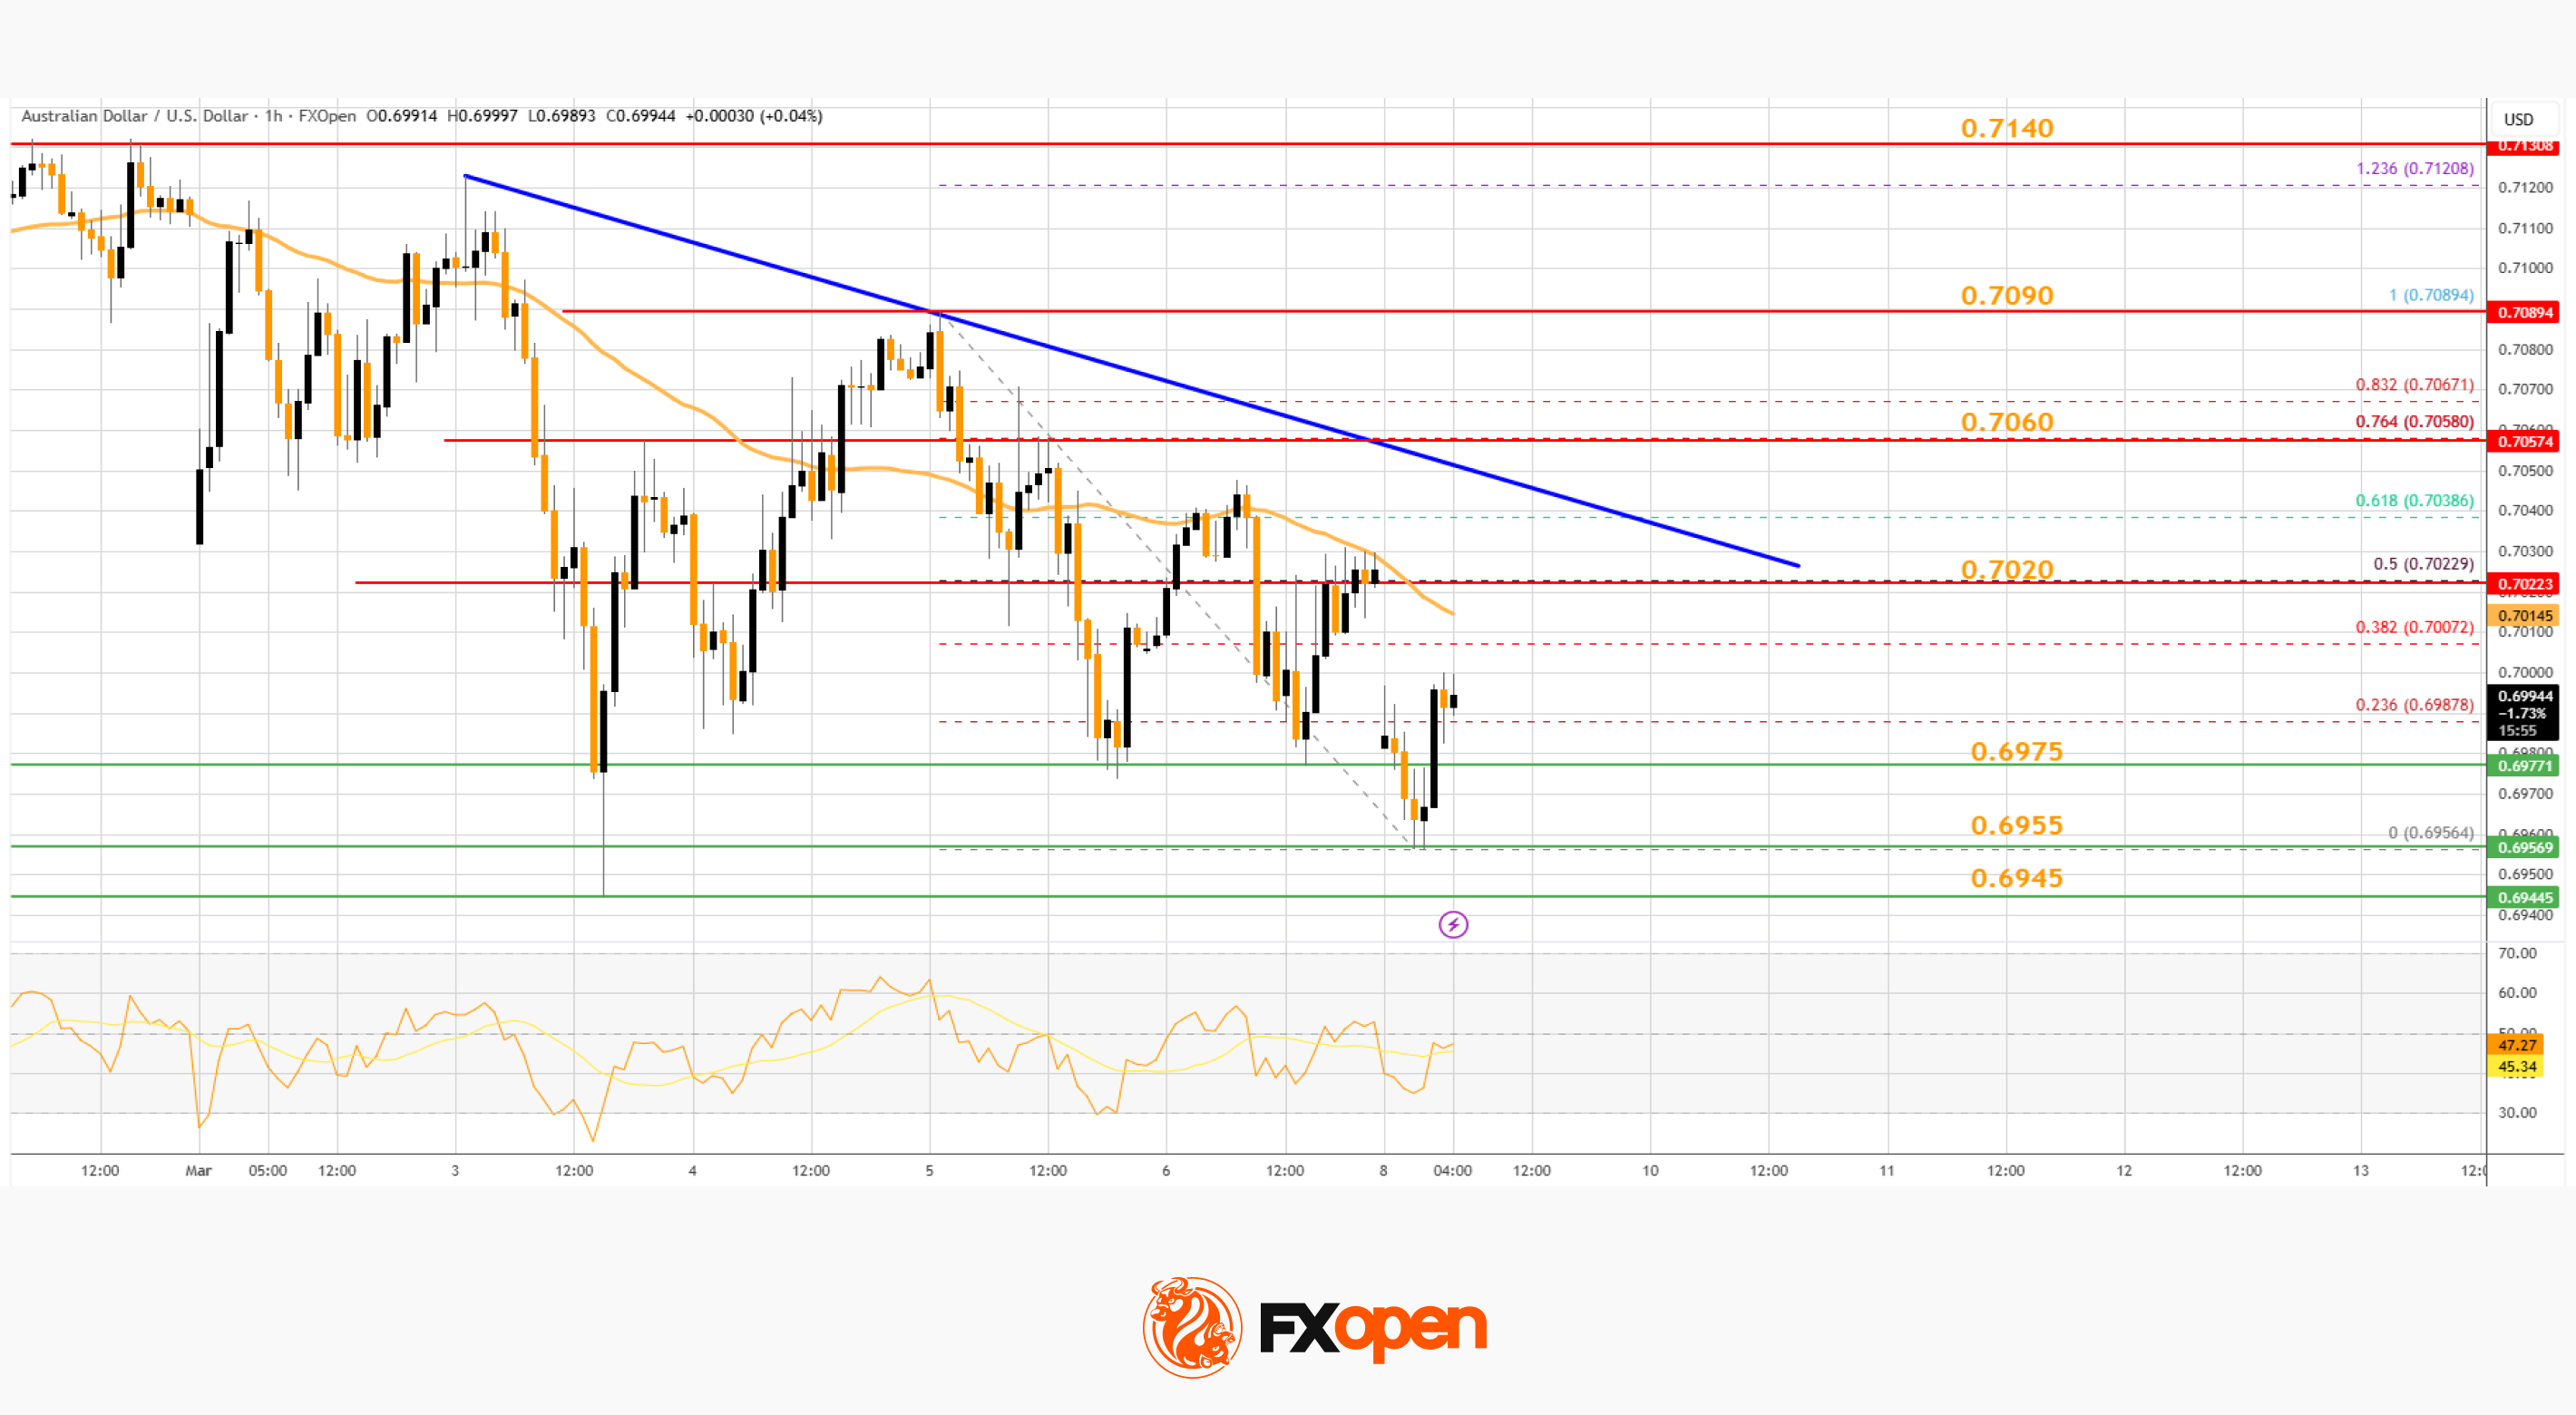
On the upside, immediate hurdle is near the 50-hour simple moving average and the 50% Fib retracement at 0.7020. There is also a bearish trend line forming with resistance at 0.7020.
The next major level for the bears could be 7060. The main selling point could be 0.7090, above which the price could rise toward 0.7140. Any more gains might send the pair toward 0.7200. A close above 0.7200 could start another steady increase in the near term. In the stated case, the next key resistance on the AUD/USD chart could be 0.7280.
On the downside, initial support is near 0.6975. The next area of interest might be 0.6955. If there is a downside break below 0.6955, the pair could extend its decline. The next target for the bears might be 0.6920. Any more losses might send the pair toward 0.6900.
NZD/USD Technical Analysis
On the hourly chart of NZD/USD on FXOpen, the pair also followed a similar pattern and declined from the 0.6000 zone. The New Zealand Dollar gained bearish momentum and traded below 0.5950 against the US Dollar.
The pair settled below 0.5900 and the 50-hour simple moving average. Finally, it tested 0.5850 and is currently consolidating losses. There was a minor increase above the 23.6% Fib retracement level of the downward move from the 0.5948 swing high to the 0.5848 low.
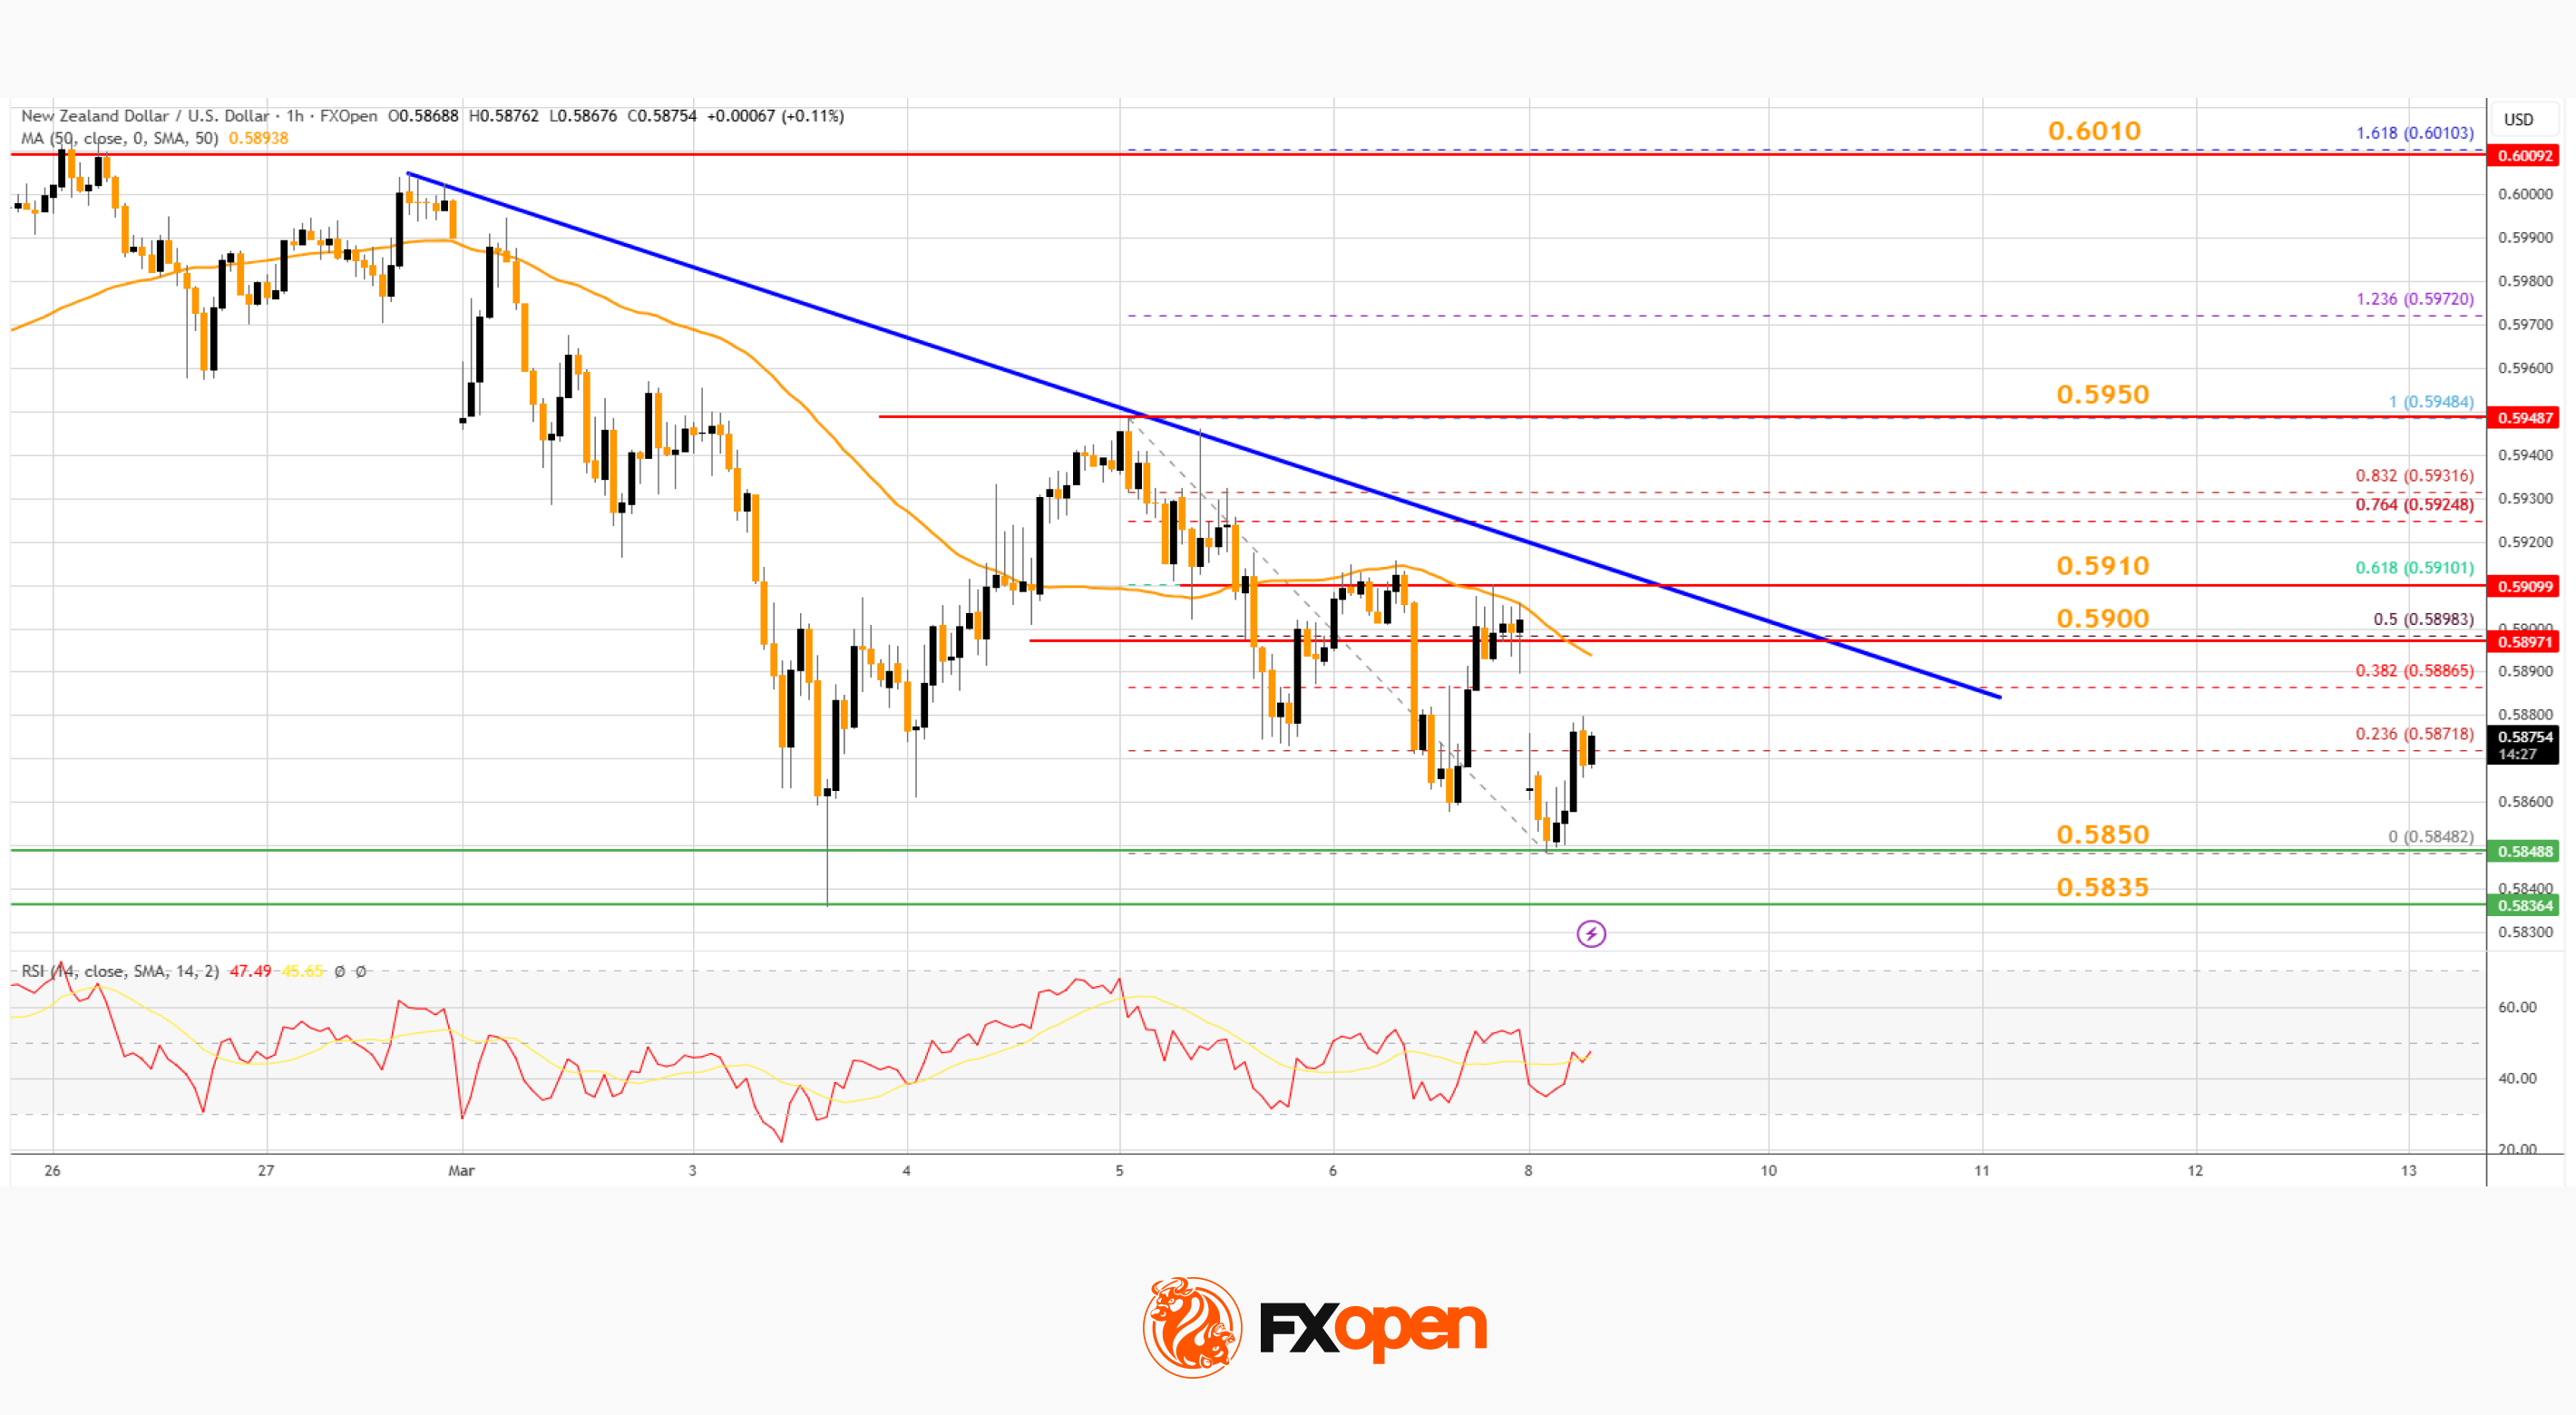
If the pair recovers, it could face hurdles near 0.5900 and a key bearish trend line. The next major barrier is at 0.5910 since it coincides with the 61.8% Fib retracement.
If there is a move above 0.5910, the pair could rise toward 0.5950. Any more gains might open the doors for a move toward 0.6010 in the coming days. On the downside, immediate support on the NZD/USD chart is 0.5850.
The next major stop for the bears might be 0.5835. If there is a downside break below 0.5835, the pair could extend its decline toward 0.5800. The main target for the bears could be 0.5740.
Trade over 50 forex markets 24 hours a day with FXOpen. Take advantage of low commissions, deep liquidity, and spreads from 0.0 pips (additional fees may apply). Open your FXOpen account now or learn more about trading forex with FXOpen.
This article represents the opinion of the Companies operating under the FXOpen brand only. It is not to be construed as an offer, solicitation, or recommendation with respect to products and services provided by the Companies operating under the FXOpen brand, nor is it to be considered financial advice.
Stay ahead of the market!
Subscribe now to our mailing list and receive the latest market news and insights delivered directly to your inbox.


Latest articles

Dollar Index (DXY) Hits Yearly High
Today, the dollar index rose above last week’s peak around the 99.68 level, setting a new high for 2026. This movement is supported by a tense fundamental backdrop:
→ Inflationary pressures from rising oil prices. Markets may be pricing

WTI Oil Price Rises Above $100
Another shocking Monday for the energy market. Last week’s start was remembered for a bullish gap of more than 10% (which was later followed by a pullback), but today’s market open proved even more volatile (as reflected by

What Is an Inverted Hammer Candlestick Pattern in Trading?
Candlestick patterns are widely used in technical analysis