


FXOpen

AUD/USD is attempting a fresh increase from 0.6630. NZD/USD is consolidating and could aim for a move above 0.5800 in the short term.
Important Takeaways for AUD/USD and NZD/USD Analysis Today
· The Aussie Dollar started a minor pullback from 0.6685 against the US Dollar.
· There is a key bullish trend line forming with support at 0.6645 on the hourly chart of AUD/USD at FXOpen.
· NZD/USD is consolidating above 0.5765 and 0.5755.
· There is a major bullish trend line forming with support at 0.5765 on the hourly chart of NZD/USD at FXOpen.
AUD/USD Technical Analysis
On the hourly chart of AUD/USD at FXOpen, the pair formed a base above 0.6600. The Aussie Dollar started a decent increase above 0.6630 against the US Dollar to enter a short-term positive zone.
The pair struggled above 0.6680 and recently corrected some gains. The recent low was formed at 0.6632. The pair is now consolidating and facing resistance near the 50% Fib retracement level of the downward move from the 0.6677 swing high to the 0.6632 low at 0.6655 and the 50-hour simple moving average.
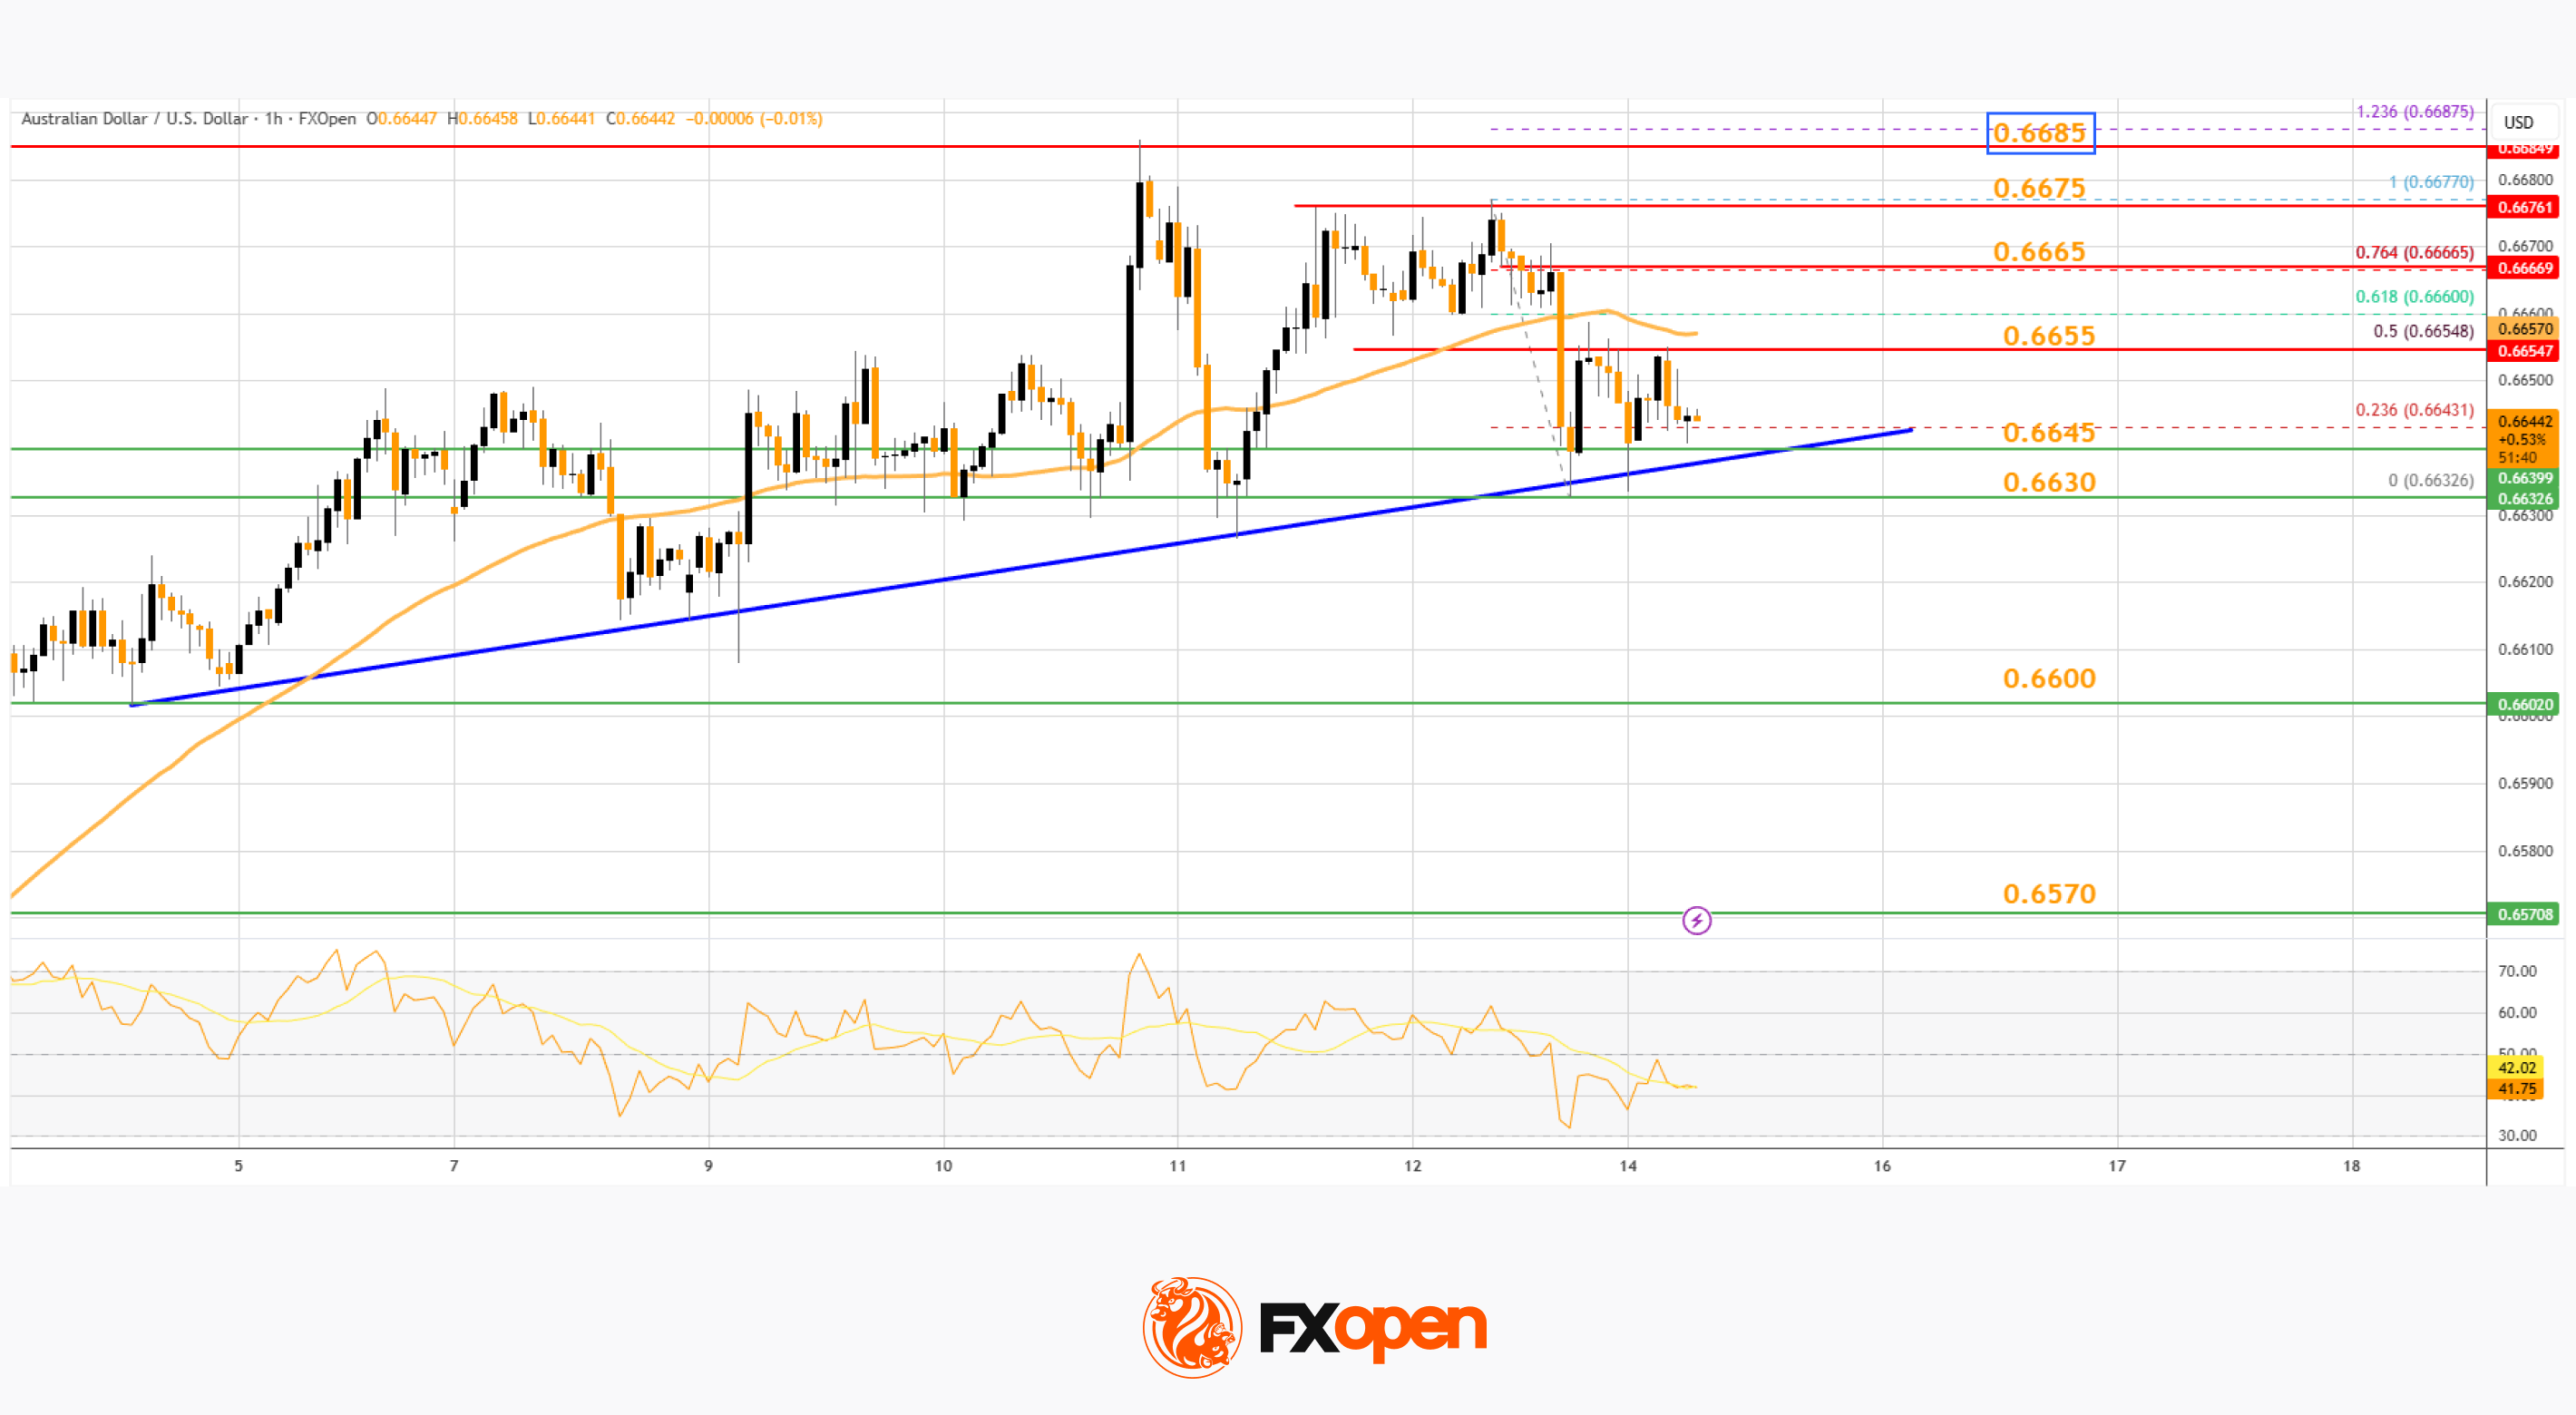
The AUD/USD chart indicates that the pair could struggle to clear the 76.4% Fib retracement at 0.6665. The first major hurdle for the bulls could be 0.6685.
An upside break above 0.6685 resistance might send the pair further higher. The next major target is near the 0.6720 level. Any more gains could clear the path for a move toward 0.6750. If there is no close above 0.6665, the pair might start a fresh decline.
Immediate bid zone could be near the 0.6645 level. There is also a key bullish trend line forming with support at 0.6645. The next area of interest is 0.6630. If there is a downside break below 0.6630, the pair could extend its decline toward 0.6600. Any more losses might signal a move toward 0.6570.
NZD/USD Technical Analysis
On the hourly chart of NZD/USD on FXOpen, the pair also followed AUD/USD. The New Zealand Dollar failed to stay above 0.5800 and corrected gains against the US Dollar.
The pair dipped below 0.5790 and the 50-hour simple moving average and 0.5830. A low was formed at 0.5765, and the pair is now consolidating below the 23.6% Fib retracement level of the downward move from the 0.5831 swing high to the 0.5765 low.
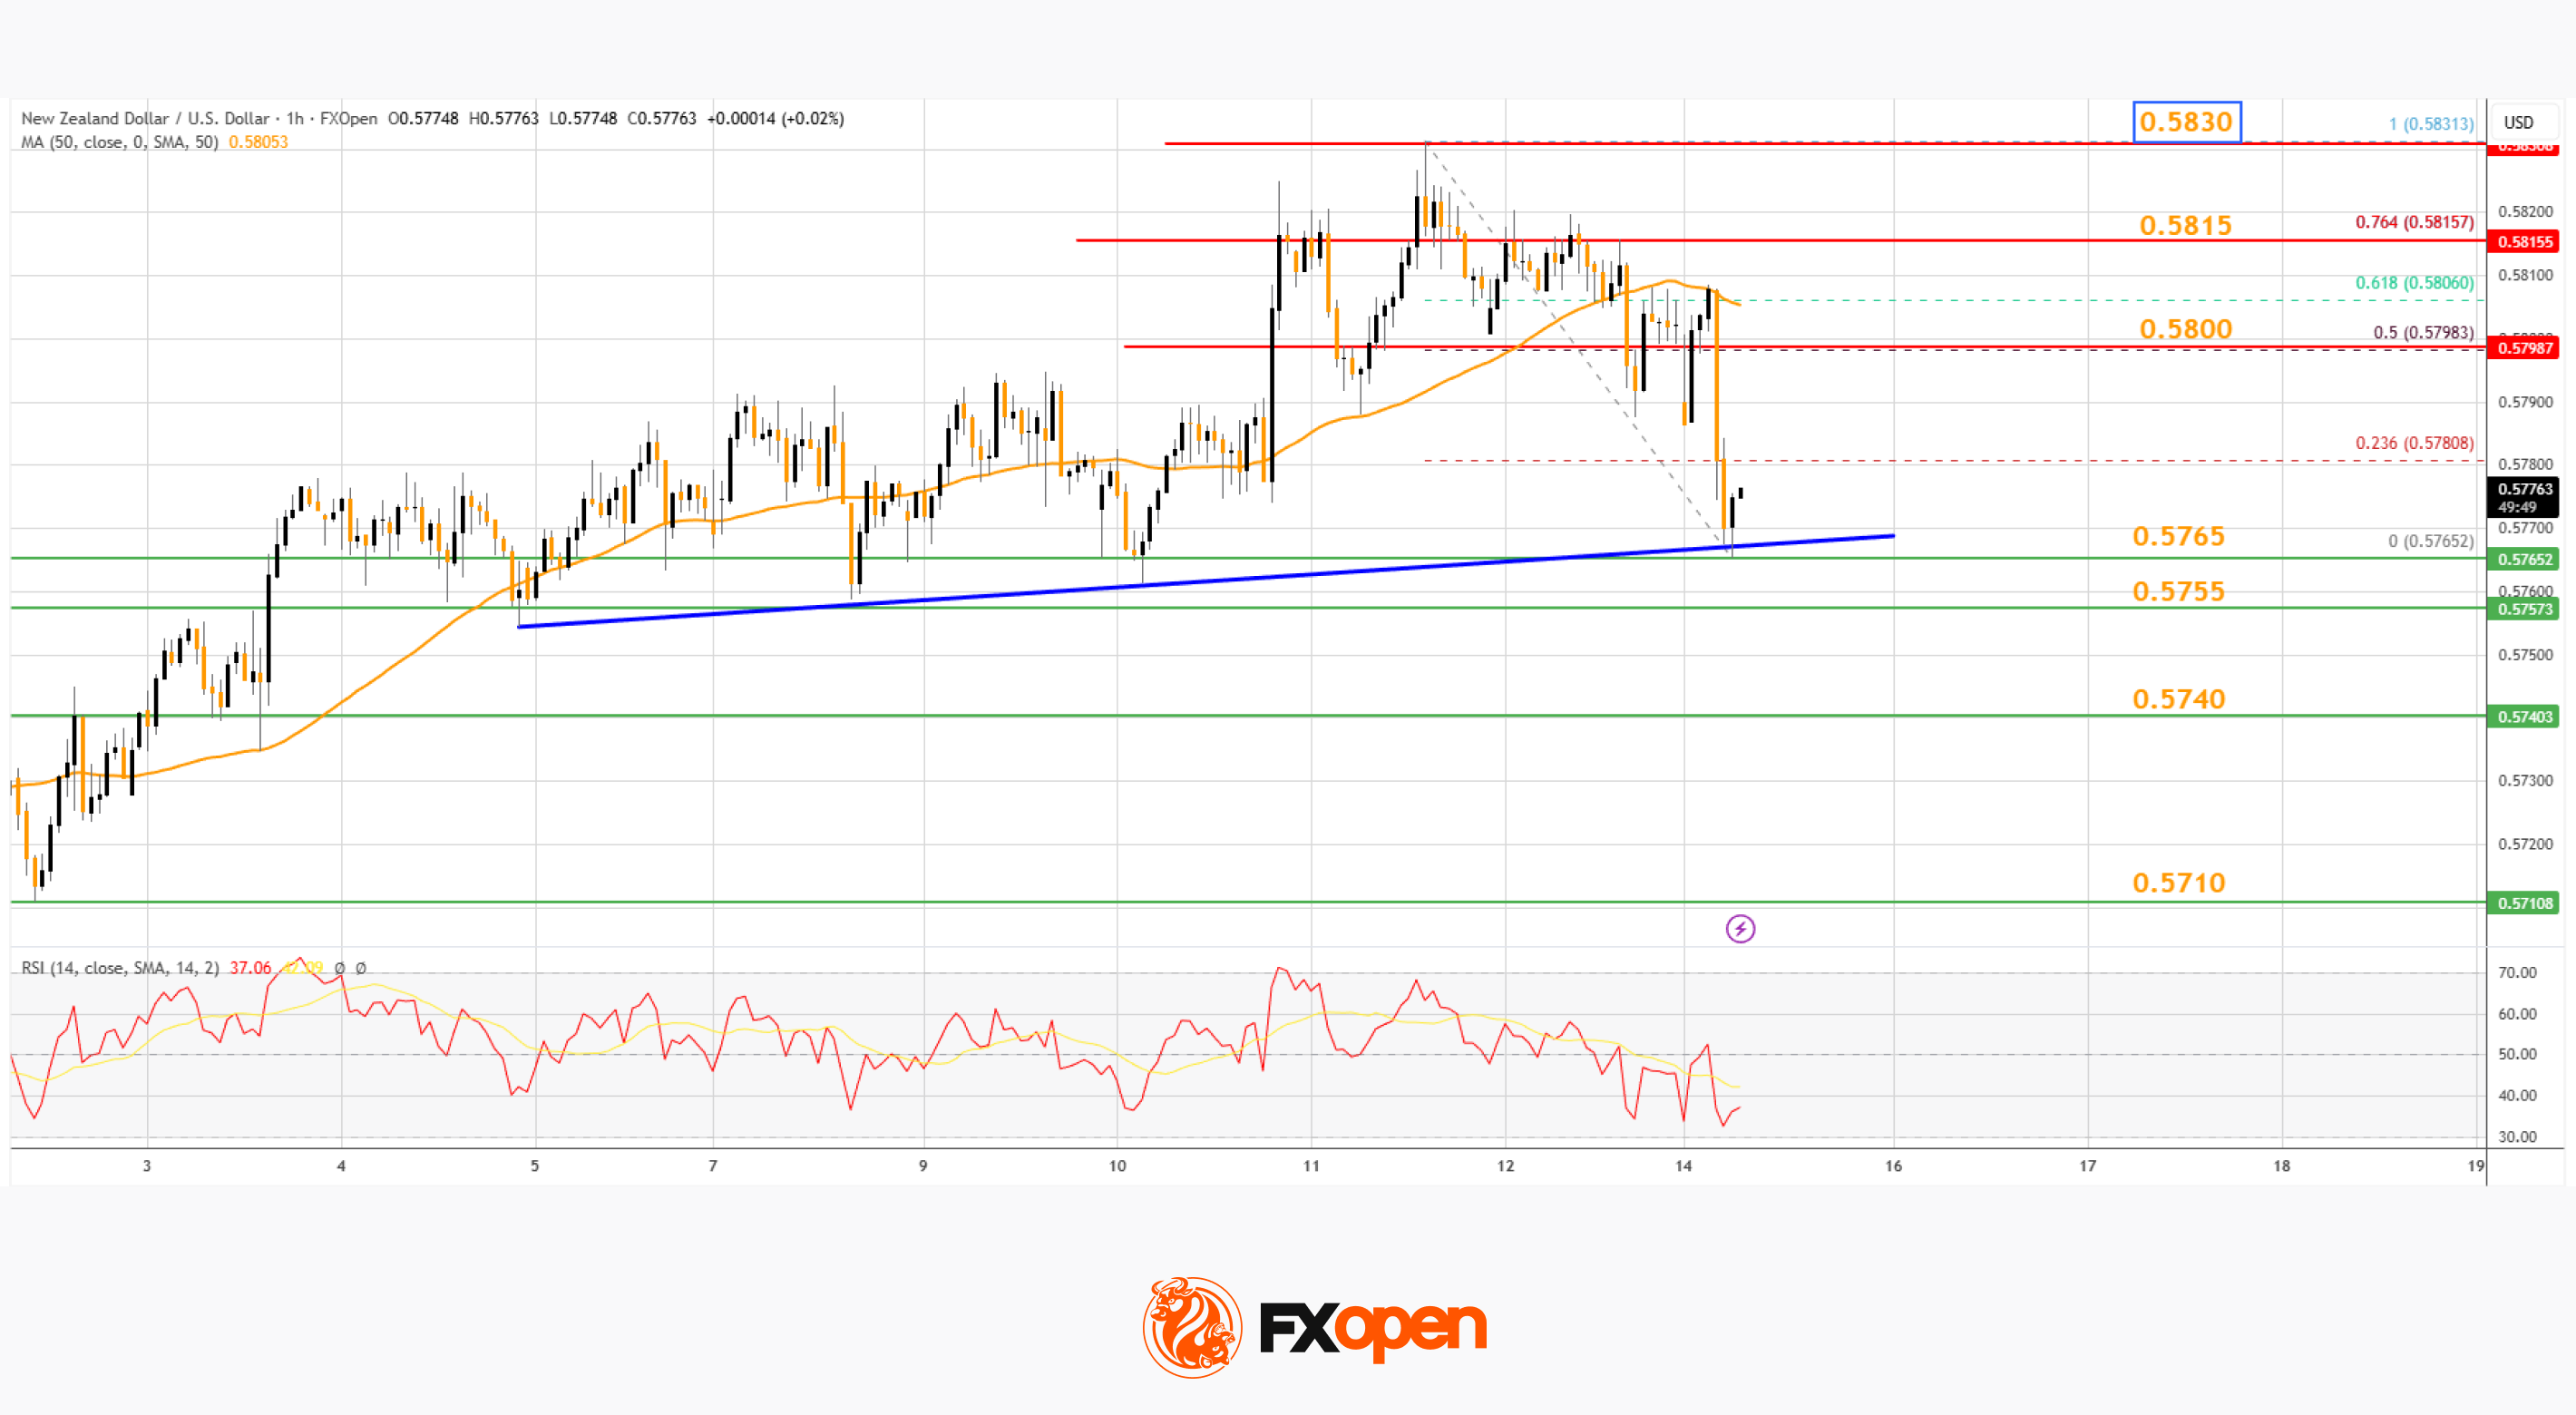
The NZD/USD chart suggests that the RSI is below 40, signaling a short-term negative bias. On the upside, the pair is facing resistance near the 50% Fib retracement level at 0.5800.
The next major hurdle for buyers could be 0.5815. A clear move above 0.5815 might even push the pair toward 0.5830. Any more gains might clear the path for a move toward the 0.5880 pivot zone in the coming sessions.
On the downside, there is support forming near the 0.5765 zone and a bullish trend line. If there is a downside break below 0.5765, the pair might slide toward 0.5740. Any more losses could lead NZD/USD into a bearish zone to 0.5710.
Trade over 50 forex markets 24 hours a day with FXOpen. Take advantage of low commissions, deep liquidity, and spreads from 0.0 pips (additional fees may apply). Open your FXOpen account now or learn more about trading forex with FXOpen.
This article represents the opinion of the Companies operating under the FXOpen brand only. It is not to be construed as an offer, solicitation, or recommendation with respect to products and services provided by the Companies operating under the FXOpen brand, nor is it to be considered financial advice.
Stay ahead of the market!
Subscribe now to our mailing list and receive the latest market news and insights delivered directly to your inbox.


Latest articles

Alphabet (GOOGL) Shares Fall to 2026 Low
As the chart shows, Alphabet (GOOGL) shares have dropped to their lowest level of 2026, with trading closing well below the psychological $300 per share mark.
Why Have Alphabet (GOOGL) Shares Declined?
The bearish move is driven by a combination

FX Market Awaits Macro Data: EUR/USD and GBP/USD Near Range Boundaries
European currencies are trading without a clear direction against the US dollar, remaining in a consolidation phase following the earlier decline driven by USD strength. At the start of the week, both EUR/USD and GBP/USD attempted a recovery,

Market Analysis: AUD/USD, NZD/USD Struggle at Resistance, Upside Chances Diminish
AUD/USD is attempting a recovery wave from 0.6910. NZD/USD is also correcting losses and might recover if there is a clear move above 0.5885.
Important Takeaways for AUD/USD and NZD/USD Analysis Today
· The Aussie