


Market Analysis: AUD/USD and NZD/USD Turn Red
FXOpen

AUD/USD declined below the 0.6500 and 0.6455 support levels. NZD/USD is also moving lower and might struggle to recover above 0.5950.
Important Takeaways for AUD/USD and NZD/USD Analysis Today
· The Aussie Dollar started a fresh decline from well above the 0.6500 level against the US Dollar.
· There is a connecting bearish trend line forming with resistance at 0.6410 on the hourly chart of AUD/USD at FXOpen.
· NZD/USD declined steadily from the 0.6000 resistance zone.
· There is a key bearish trend line forming with resistance at 0.5890 on the hourly chart of NZD/USD at FXOpen.
AUD/USD Technical Analysis
On the hourly chart of AUD/USD at FXOpen, the pair struggled to clear the 0.6540 zone. The Aussie Dollar started a fresh decline below the 0.6500 support against the US Dollar.
The pair even settled below 0.6455 and the 50-hour simple moving average. There was a clear move below 0.6400. A low was formed at 0.6362 and the pair is now attempting a recovery wave. There was a move above the 23.6% Fib retracement level of the downward move from the 0.6456 swing high to the 0.6362 low.
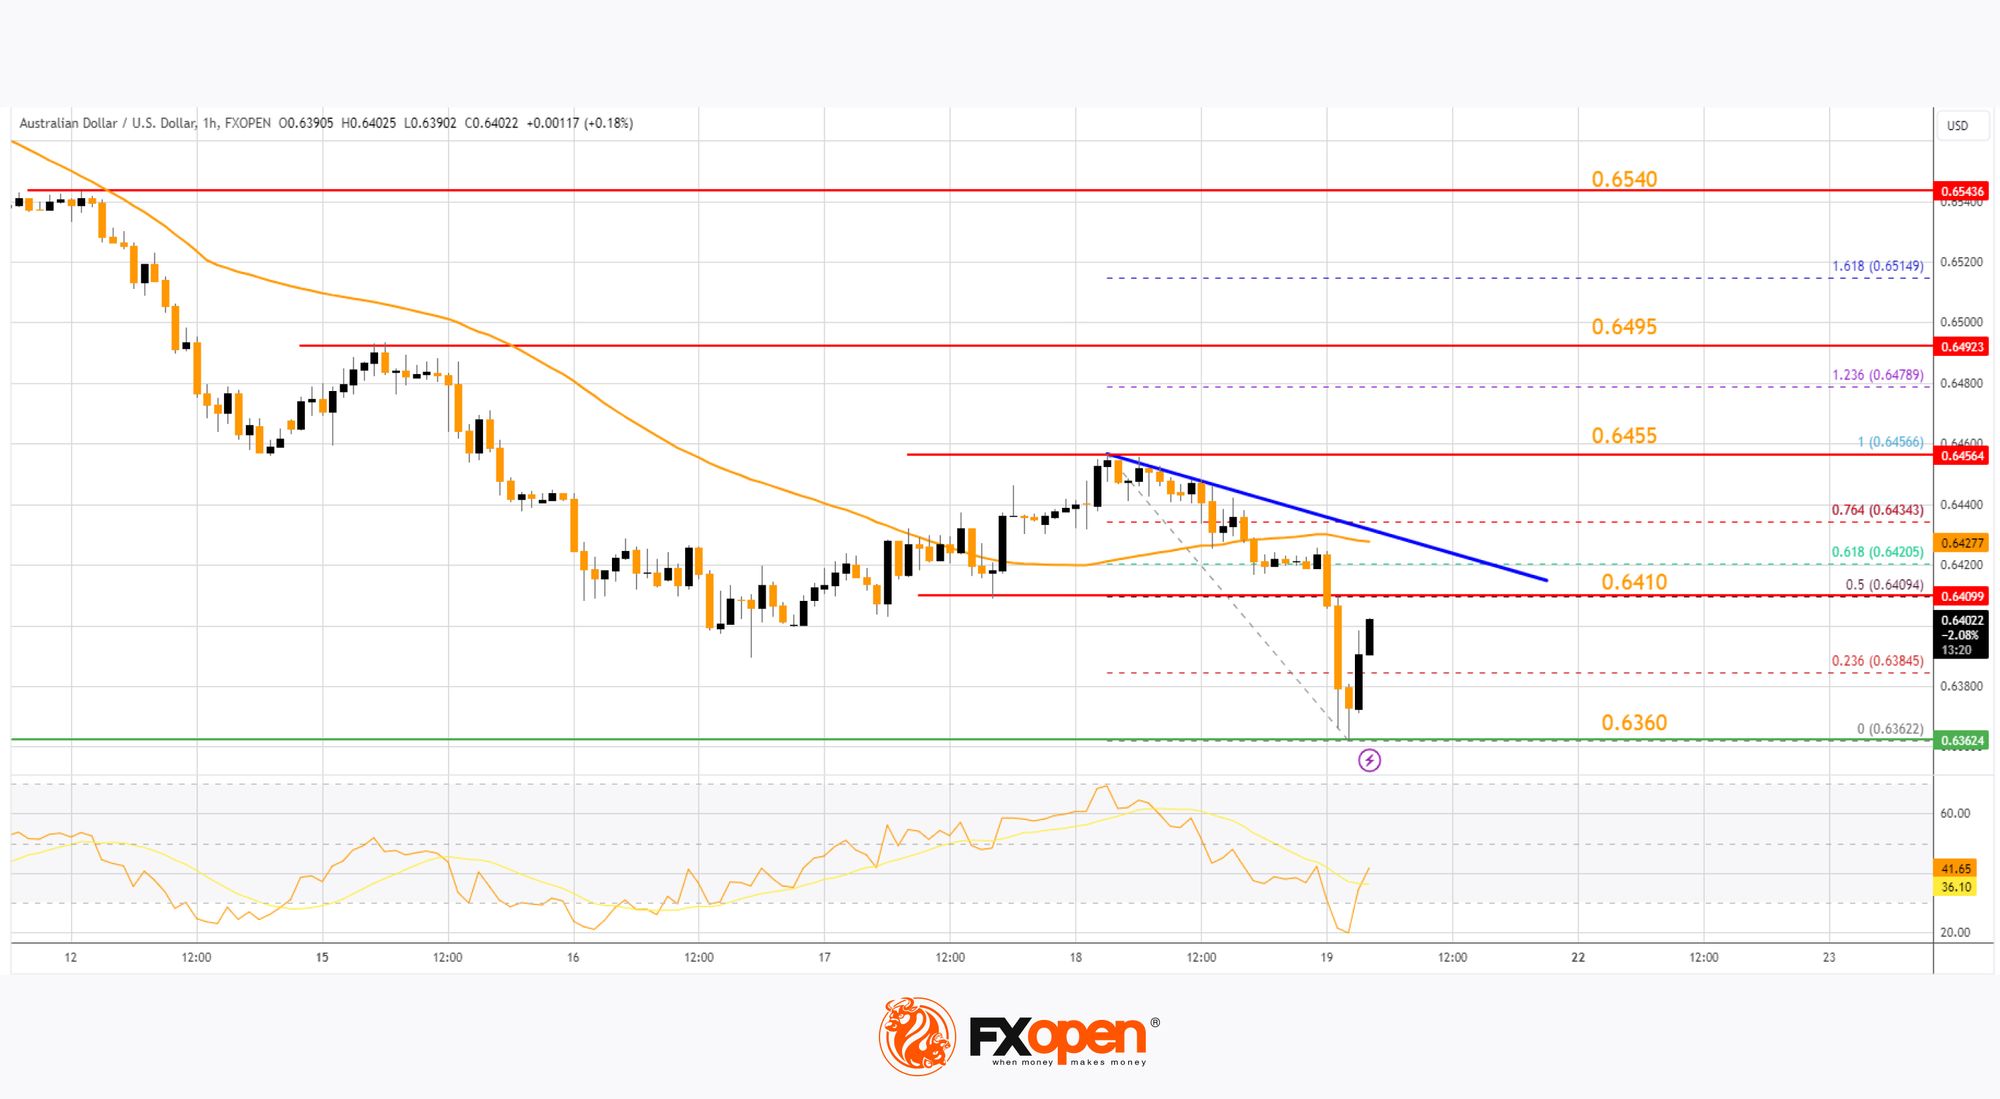
On the upside, an immediate resistance is near the 0.6410 level. There is also a connecting bearish trend line forming with resistance at 0.6410 and the 50% Fib retracement level of the downward move from the 0.6456 swing high to the 0.6362 low.
The next major resistance is near 0.6455, above which the price could rise toward 0.6540. Any more gains might send the pair toward 0.6600. A close above the 0.6600 level could start another steady increase in the near term. The next major resistance on the AUD/USD chart could be 0.6680.
On the downside, initial support is near the 0.6360 zone. The next support sits at 0.6340. If there is a downside break below 0.6340, the pair could extend its decline. The next support could be 0.6300. Any more losses might send the pair toward the 0.6265 support.
NZD/USD Technical Analysis
On the hourly chart of NZD/USD on FXOpen, the pair also followed a similar pattern and declined from the 0.6010 zone. The New Zealand Dollar gained bearish momentum and traded below 0.5950 against the US Dollar.
The pair settled below the 0.5930 level and the 50-hour simple moving average. Finally, it tested the 0.5850 zone and is currently attempting a minor recovery wave. There was a move above the 23.6% Fib retracement level of the downward move from the 0.5932 swing high to the 0.5852 low.
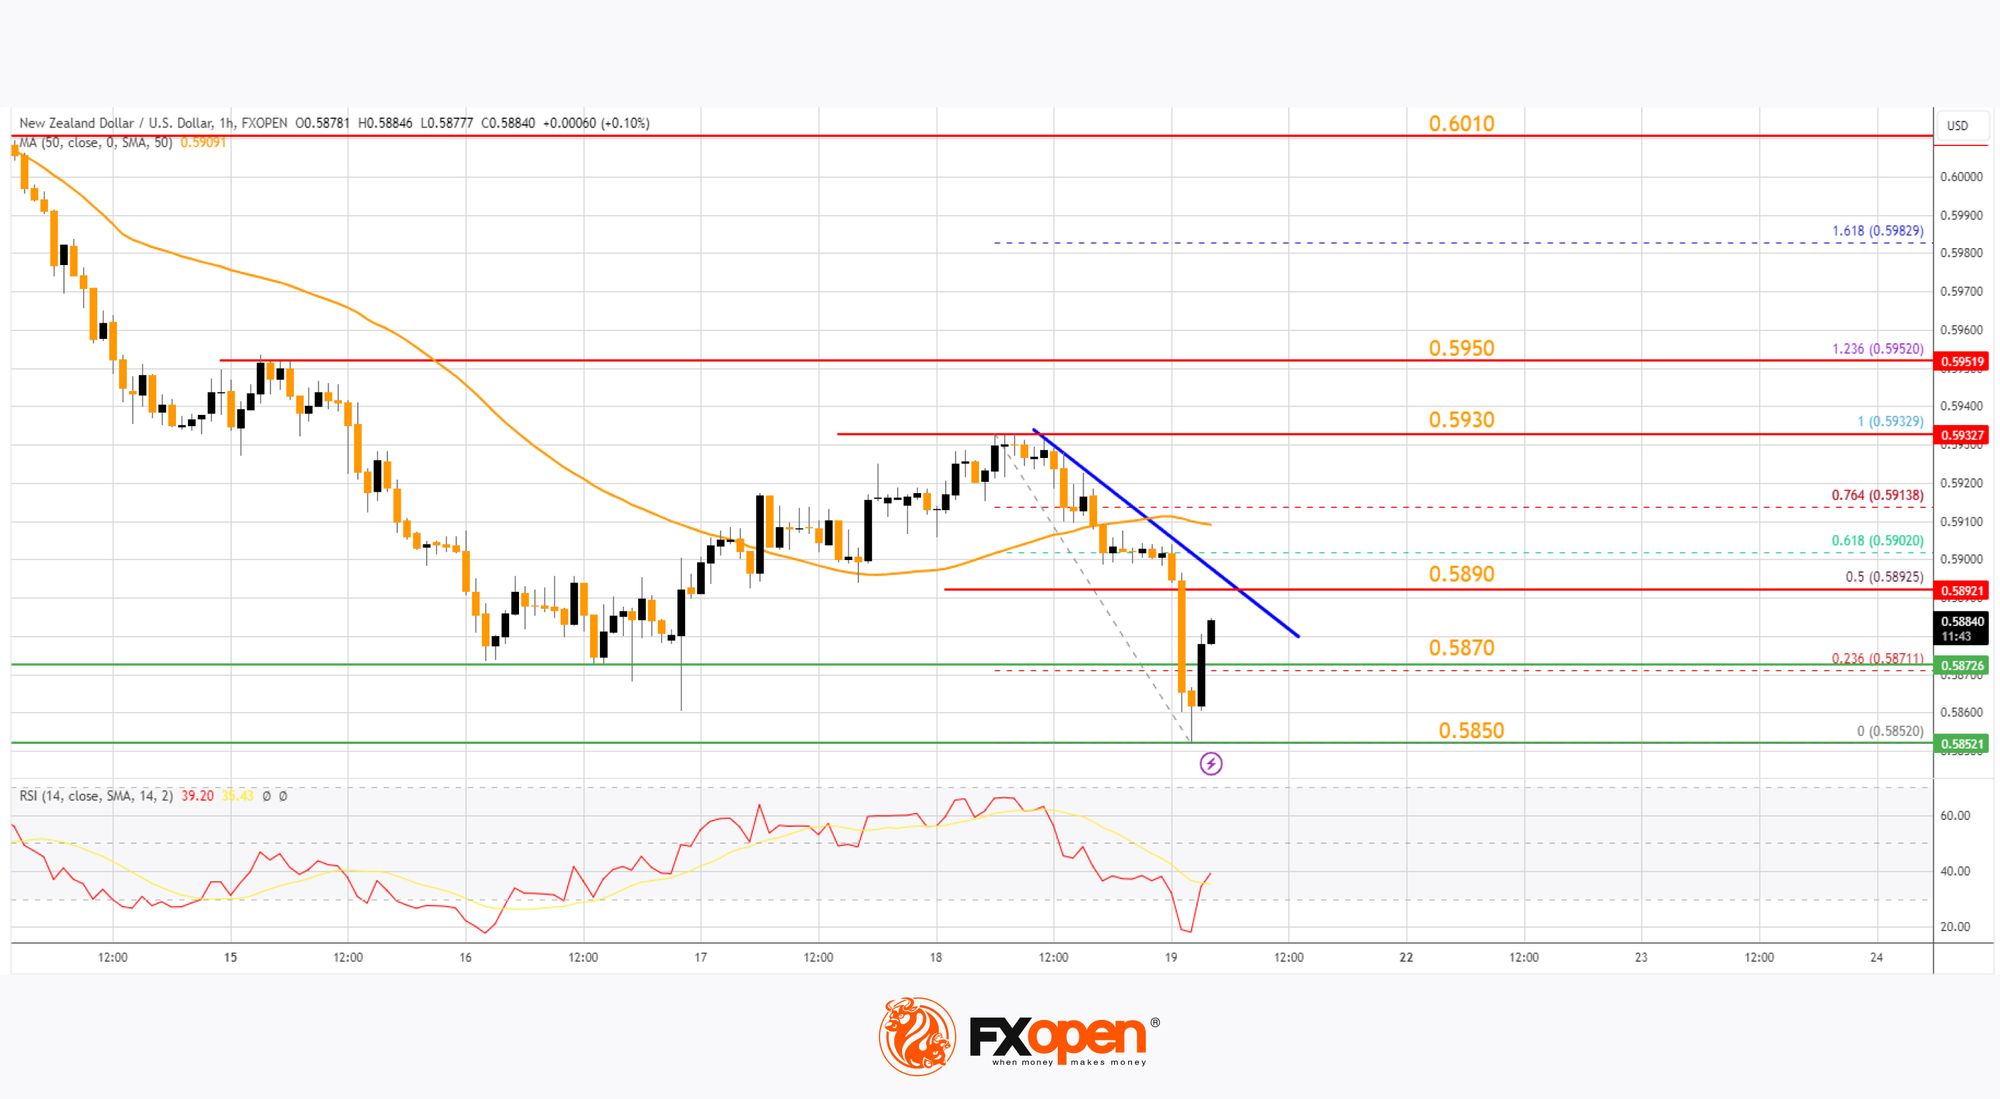
Immediate resistance on the upside is near 0.5890. There is also a key bearish trend line forming with resistance at 0.5890 and the 50% Fib retracement level of the downward move from the 0.5932 swing high to the 0.5852 low.
The next resistance is at 0.5910 and the 50-hour simple moving average. If there is a move above 0.5910, the pair could rise toward 0.5930. Any more gains might open the doors for a move toward the 0.5950 resistance zone in the coming days.
On the downside, immediate support on the NZD/USD chart is near the 0.5870 level. The next major support is near the 0.5850 zone. If there is a downside break below 0.5850, the pair could extend its decline toward the 0.5815 level. The next key support is near 0.5880.
Trade over 50 forex markets 24 hours a day with FXOpen. Take advantage of low commissions, deep liquidity, and spreads from 0.0 pips (additional fees may apply). Open your FXOpen account now or learn more about trading forex with FXOpen.
This article represents the opinion of the Companies operating under the FXOpen brand only. It is not to be construed as an offer, solicitation, or recommendation with respect to products and services provided by the Companies operating under the FXOpen brand, nor is it to be considered financial advice.
Stay ahead of the market!
Subscribe now to our mailing list and receive the latest market news and insights delivered directly to your inbox.


Latest articles

Ethereum: Has the Recovery Begun?
Ethereum has staged a notable rebound after once again testing the heavily watched psychological zone around 1500$. Since bouncing off this support, ETH/USD has climbed roughly 13%, now trading around the $1,700 mark.
This recovery is being driven

Oil Prices Are Back at Pre-Conflict Levels. Analysts Are Divided
At the start of May, oil markets were still pricing in elevated geopolitical risk and expectations of sustained supply disruption.
But easing tensions between Washington and Tehran, along with improving supply expectations, have rapidly shifted sentiment back toward fundamentals.
📉 Brent

The Dollar Awaits the Week’s Key Report: AUD/USD and NZD/USD at Crucial Technical Levels
Following mixed performance by the US dollar earlier this week, investors are now fully focused on the June Nonfarm Payrolls report, which will be released on Thursday rather than Friday. The schedule has been brought forward as US financial markets