


Market Analysis: AUD/USD Attempts Fresh Climb as NZD/USD Slips
FXOpen

AUD/USD is attempting a fresh increase from the 0.6485 support. NZD/USD is struggling and might decline below the 0.5980 level.
Important Takeaways for AUD/USD and NZD/USD Analysis Today
- The Aussie Dollar found support at 0.6485 and recovered against the US Dollar.
- There is a key bearish trend line forming with resistance at 0.6535 on the hourly chart of AUD/USD at FXOpen.
- NZD/USD is consolidating above the 0.5980 support.
- There is a connecting bearish trend line forming with resistance at 0.6010 on the hourly chart of NZD/USD at FXOpen.
AUD/USD Technical Analysis
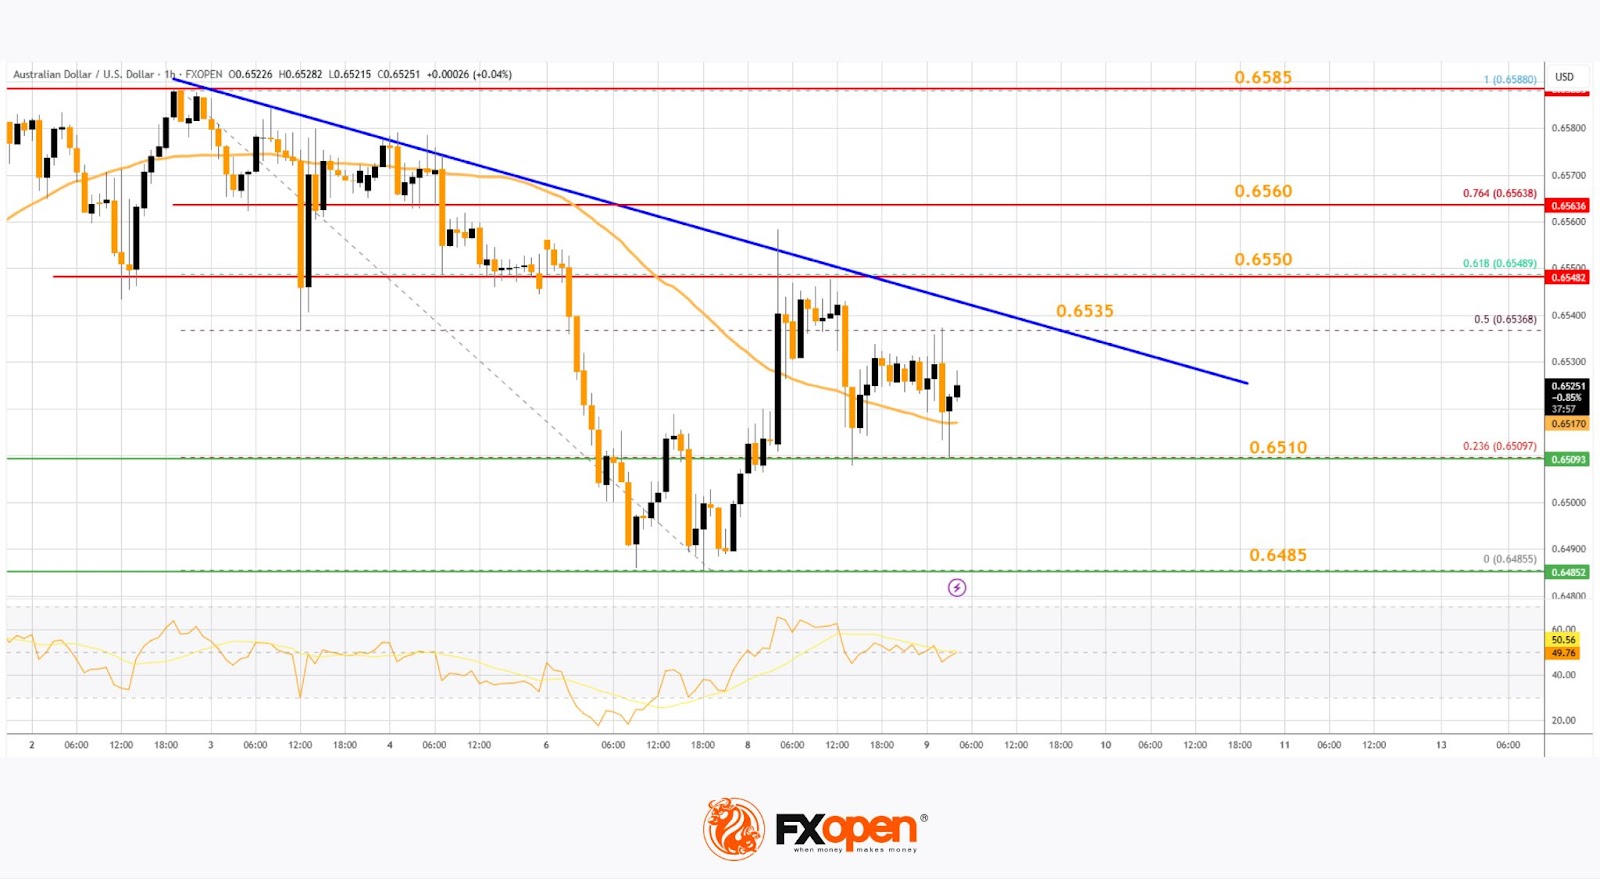
On the hourly chart of AUD/USD at FXOpen, the pair started a fresh increase above 0.6550. The Aussie Dollar tested the 0.6585 zone before the bears appeared and pushed it lower against the US Dollar.
The pair declined below the 0.6560 and 0.6550 support levels. The recent low was formed at 0.6485 and the pair is rising again. The bulls pushed it above the 50% Fib retracement level of the downward move from the 0.6588 swing high to the 0.6485 low.
The pair is now consolidating above the 50-hour simple moving average. On the upside, the AUD/USD chart indicates that the resistance is near the 0.6535 zone. There is also a key bearish trend line forming at 0.6535.
The first major resistance might be 0.6550 and the 61.8% Fib retracement level. An upside break above it might send the pair further higher. The next major resistance is near the 0.6560 level. Any more gains could clear the path for a move toward the 0.6585 resistance zone.
If not, the pair might correct lower. Immediate support sits near the 0.6510 level. The next support could be 0.6485. If there is a downside break below 0.6485, the pair could extend its decline toward the 0.6440 zone. Any more losses might signal a move toward 0.6420.
NZD/USD Technical Analysis
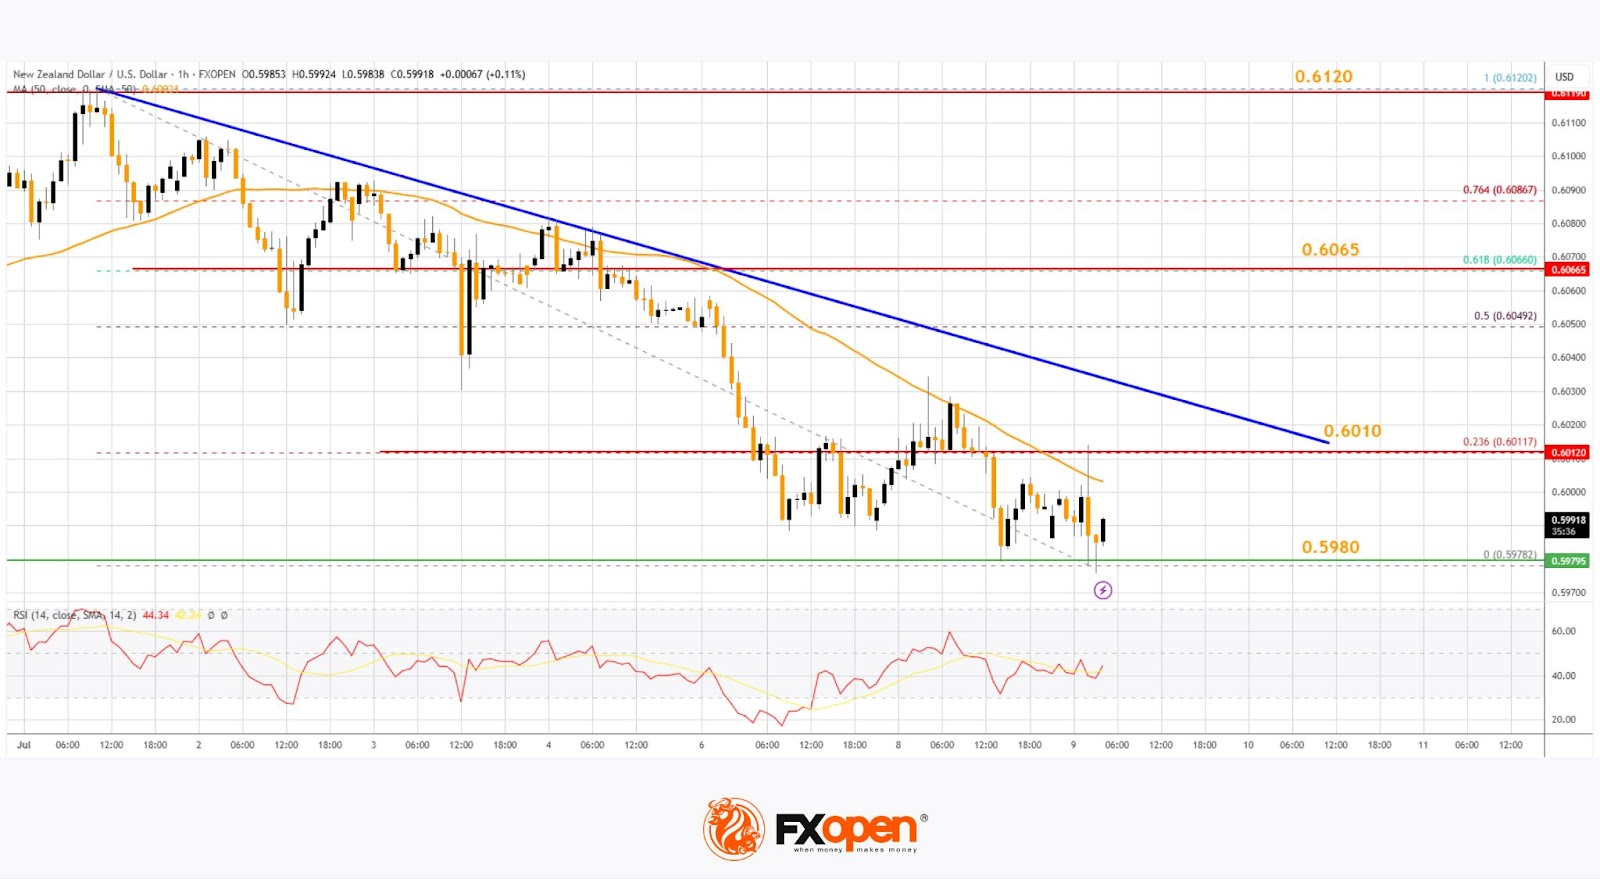
On the hourly chart of NZD/USD at FXOpen, the pair also followed AUD/USD. The New Zealand Dollar struggled above 0.6100 and started a fresh decline against the US Dollar.
There was a move below the 0.6050 and 0.6020 support levels. A low was formed at 0.5978 and the pair is now consolidating losses below the 50-hour simple moving average. The NZD/USD chart suggests that the RSI is back below 50 signalling a bearish bias.
On the upside, the pair is facing resistance near the 23.6% Fib retracement level of the downward move from the 0.6120 swing high to the 0.5978 low. There is also a connecting bearish trend line forming with resistance at 0.6010.
The next major resistance is near the 0.6065 level or the 61.8% Fib retracement level. A clear move above the 0.6065 level might even push the pair toward the 0.6120 level. Any more gains might clear the path for a move toward the 0.6150 resistance zone in the coming days.
On the downside, there is a support forming near the 0.5980 zone. If there is a downside break below 0.5980, the pair might slide toward 0.5940. Any more losses could lead NZD/USD in a bearish zone to 0.5910.
Trade over 50 forex markets 24 hours a day with FXOpen. Take advantage of low commissions, deep liquidity, and spreads from 0.0 pips (additional fees may apply). Open your FXOpen account now or learn more about trading forex with FXOpen.
This article represents the opinion of the Companies operating under the FXOpen brand only. It is not to be construed as an offer, solicitation, or recommendation with respect to products and services provided by the Companies operating under the FXOpen brand, nor is it to be considered financial advice.
Stay ahead of the market!
Subscribe now to our mailing list and receive the latest market news and insights delivered directly to your inbox.


Latest articles

Pound Weakens After Soft UK Inflation Data as Euro Awaits Fresh Market Signals
The pound remains under pressure following the release of weaker-than-expected UK inflation data. The slowdown in inflation has strengthened expectations that the Bank of England could adopt a more accommodative policy stance in the coming months, weighing on sterling. Meanwhile,

Alphabet: Record Profit as Markets Await Their Verdict
On 22 July, Alphabet reported its Q2 2026 results, with revenue rising 24% year-on-year to $119.8 billion. Google Cloud revenue surged 82% to $24.77 billion, comfortably exceeding analysts' expectations. Search advertising generated $63.3 billion in revenue (+17%

NZD/USD Analysis: A Tug-of-War at the Critical Level
The kiwi has strengthened meaningfully against most peers this month. However, against the US dollar specifically, NZD/USD remains well below its 2026 highs, trading in the mid-0.58 area versus January's peak near 0.6075.
New Zealand's Q2 inflation