


FXOpen

AUD/USD started a decent increase above the 0.6150 and 0.6200 levels. NZD/USD is also rising and might aim for more gains above 0.5850.
Important Takeaways for AUD USD and NZD USD Analysis Today
· The Aussie Dollar rebounded after forming a base above the 0.6000 level against the US Dollar.
· There is a connecting bullish trend line forming with support at 0.6260 on the hourly chart of AUD/USD at FXOpen.
· NZD/USD is consolidating gains above the 0.5765 zone.
· There is a key bullish trend line forming with support at 0.5825 on the hourly chart of NZD/USD at FXOpen.
AUD/USD Technical Analysis
On the hourly chart of AUD/USD at FXOpen, the pair started a fresh increase from the 0.5940 support. The Aussie Dollar was able to clear the 0.6065 resistance to move into a positive zone against the US Dollar.
There was a close above the 0.6200 resistance and the 50-hour simple moving average. Finally, the pair tested the 0.6315 zone. A high was formed near 0.6314 and the pair recently started a consolidation phase.
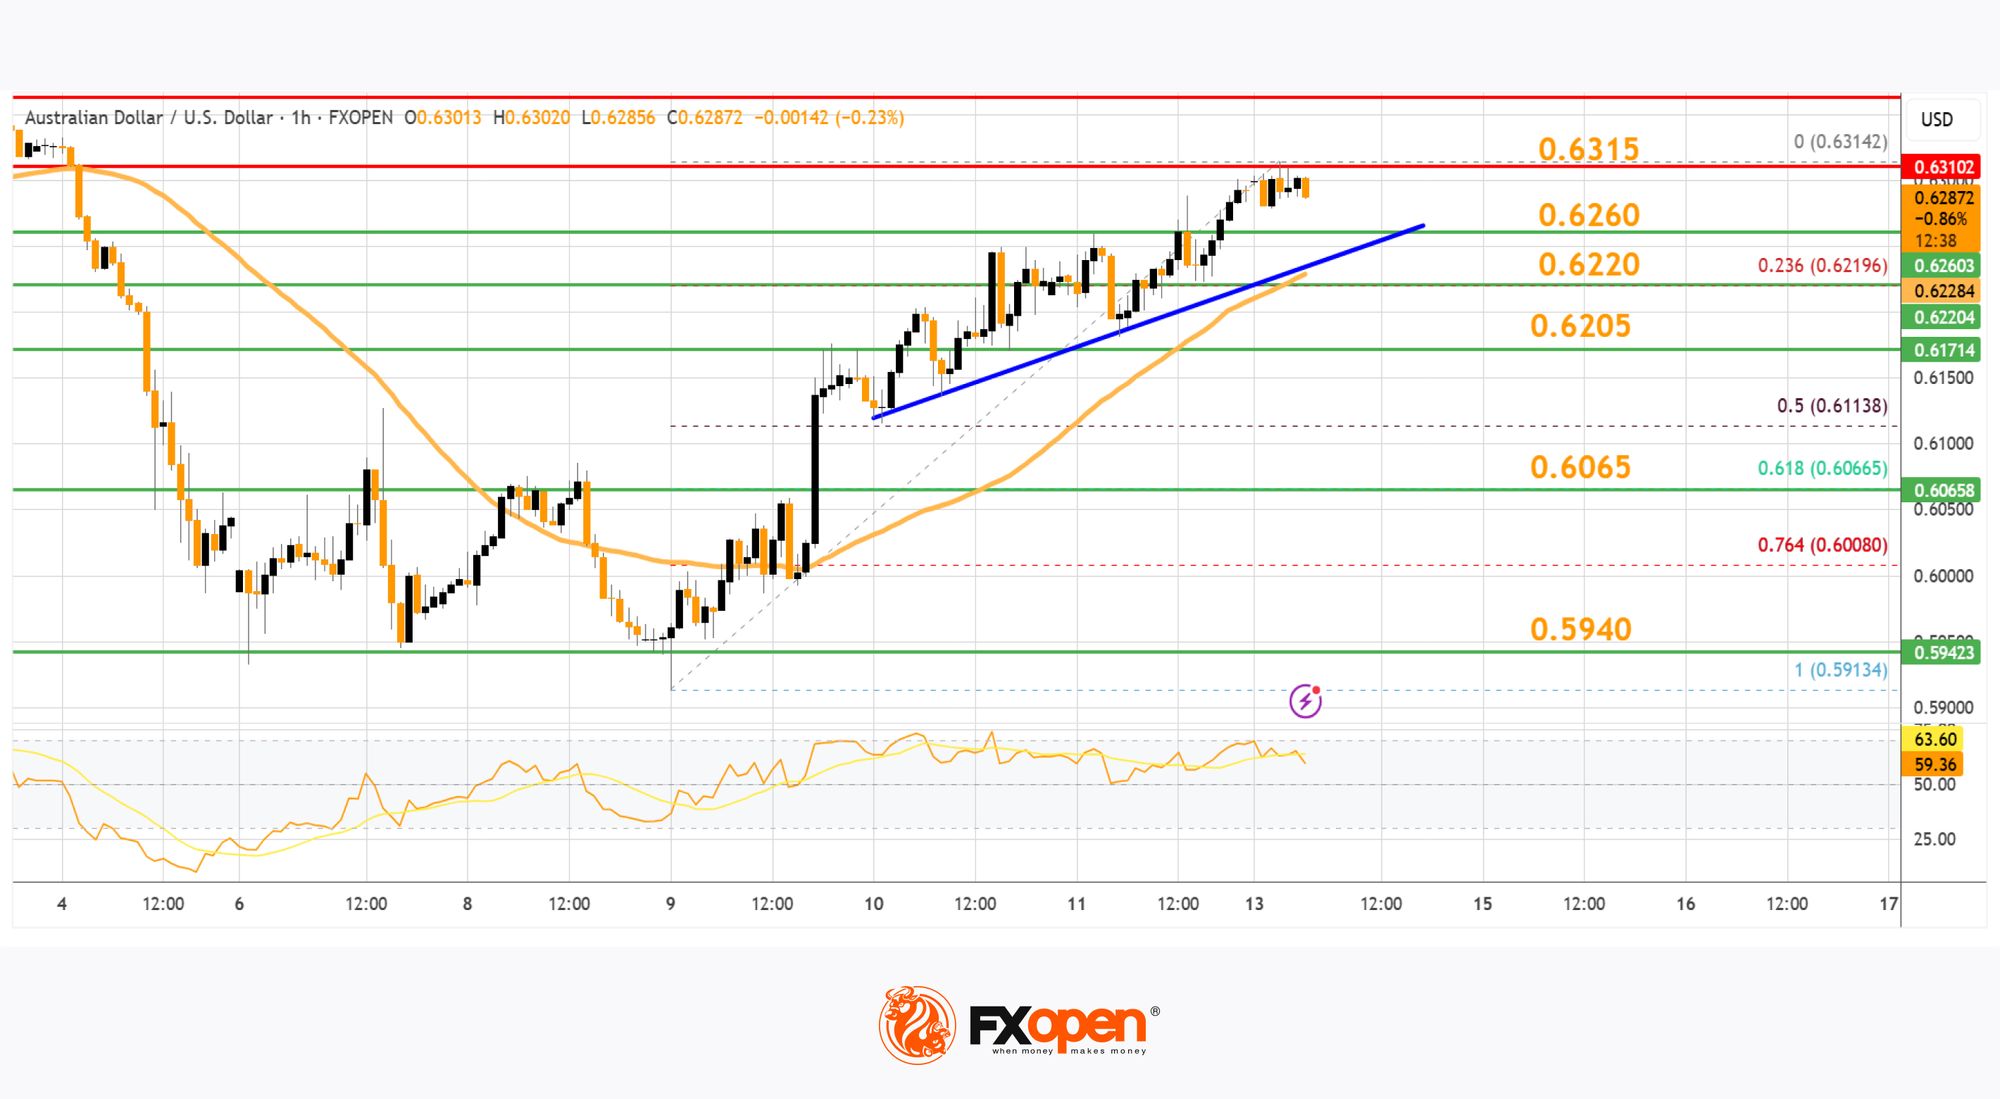
There was a move below the 0.6300 level. The pair remained above the 23.6% Fib retracement level of the upward move from the 0.5913 swing low to the 0.6314 high.
On the downside, initial support is near the 0.6260 level. There is also a connecting bullish trend line forming with support at 0.6260. The next major support is near the 0.6220 zone. If there is a downside break below the 0.6220 support, the pair could extend its decline toward the 0.6205 level.
Any more losses might signal a move toward 0.6065 and the 61.8% Fib retracement level of the upward move from the 0.5913 swing low to the 0.6314 high.
On the upside, the AUD/USD chart indicates that the pair is now facing resistance near 0.6315. The first major resistance might be 0.6340. An upside break above the 0.6340 resistance might send the pair further higher.
The next major resistance is near the 0.6385 level. Any more gains could clear the path for a move toward the 0.6450 resistance zone.
NZD/USD Technical Analysis
On the hourly chart of NZD/USD on FXOpen, the pair started a steady increase from the 0.5515 zone. The New Zealand Dollar broke the 0.5670 resistance to start the recent increase against the US Dollar.
The pair settled above 0.5765 and the 50-hour simple moving average. It tested the 0.5850 zone and is currently consolidating gains. The pair corrected lower below the 0.5840 level. However, the bulls are active above the 0.5825 level.
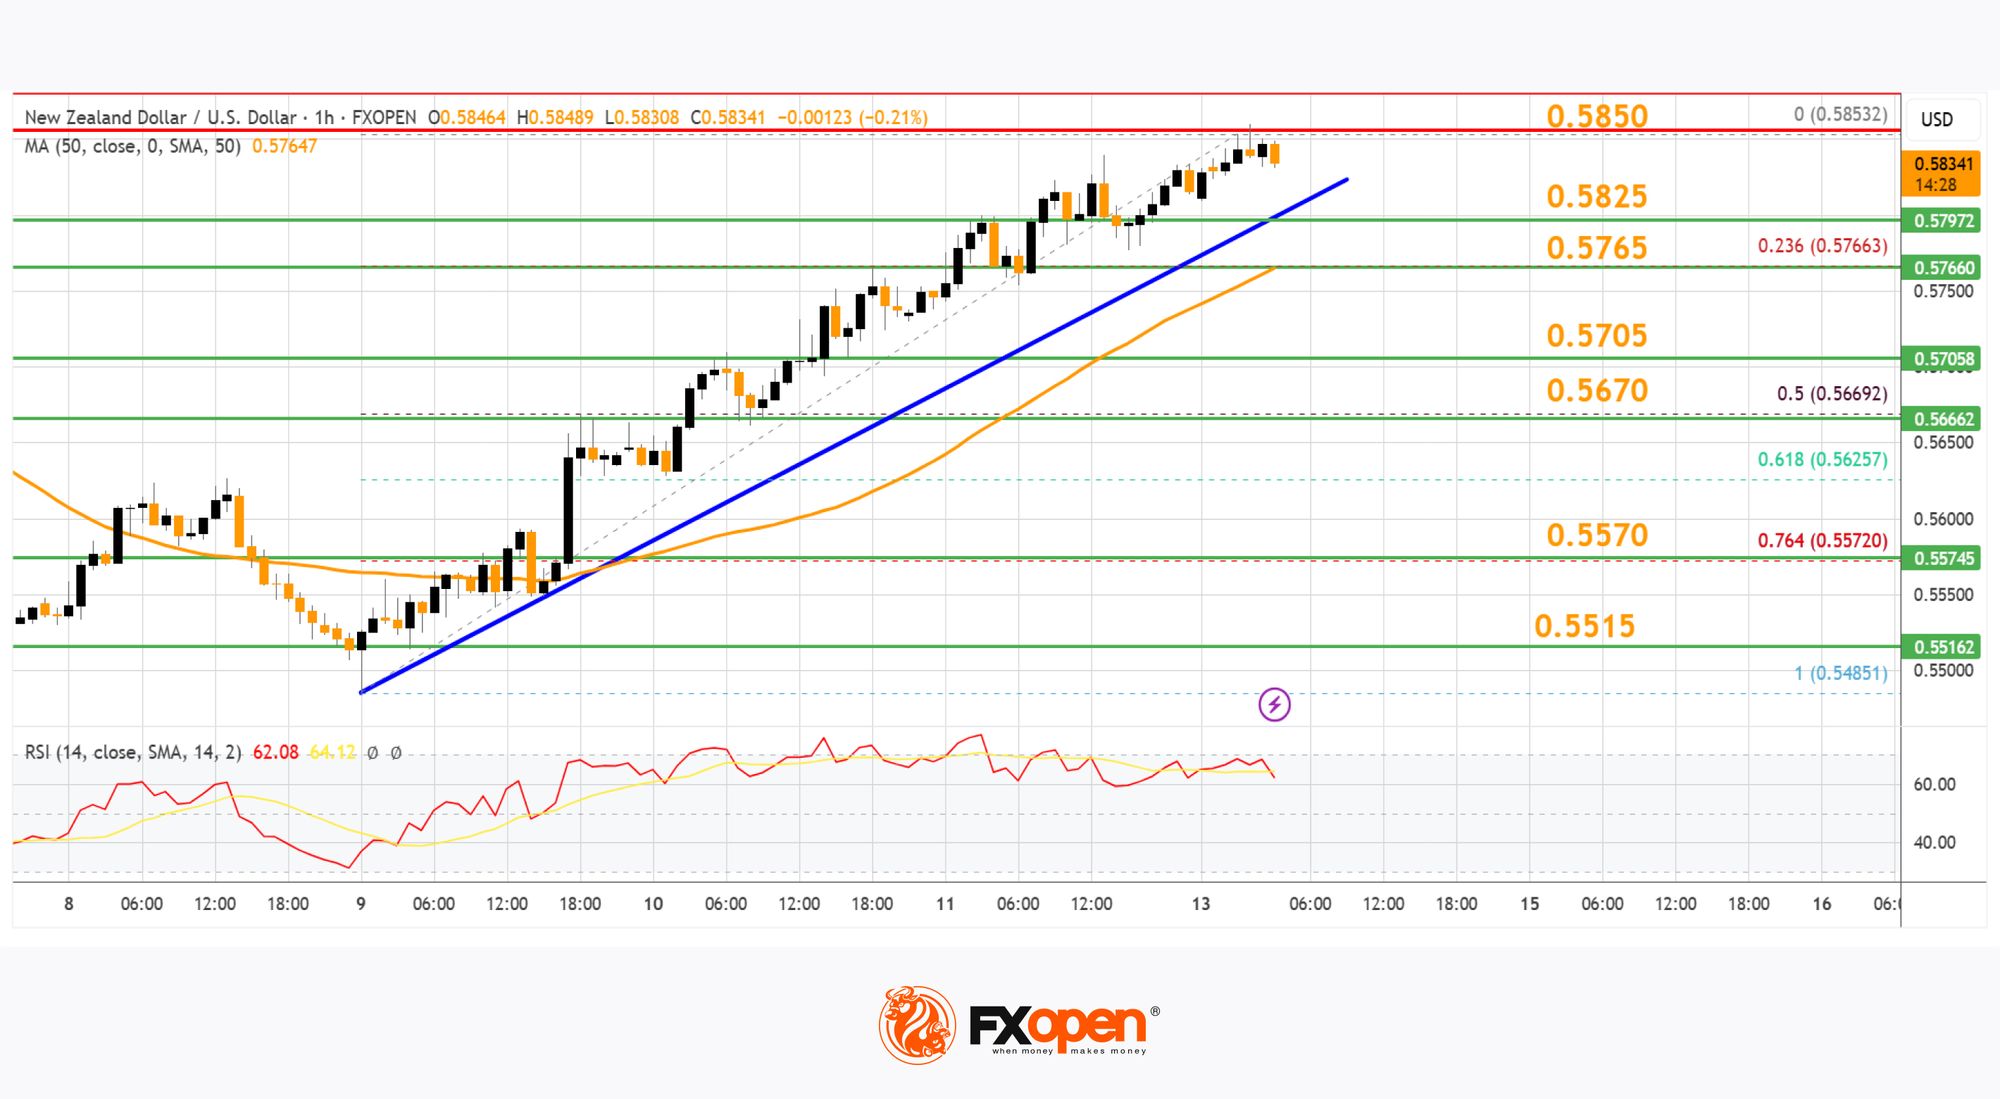
The NZD/USD chart suggests that the RSI is stable above 50. On the upside, the pair might struggle near 0.5850. The next major resistance is near the 0.5880 level.
A clear move above the 0.5880 level might even push the pair toward the 0.5920 level. Any more gains might clear the path for a move toward the 0.6000 resistance zone in the coming days.
On the downside, immediate support is near the 0.5825 level. There is also a key bullish trend line forming with support at 0.5825. The first key support is near the 0.5765 level. The next major support is near the 0.5670 level and the 50% Fib retracement level of the upward move from the 0.5485 swing low to the 0.5853 high.
If there is a downside break below the 0.5670 support, the pair might slide toward the 0.5570 support. Any more losses could lead NZD/USD in a bearish zone to 0.5515.
Trade over 50 forex markets 24 hours a day with FXOpen. Take advantage of low commissions, deep liquidity, and spreads from 0.0 pips (additional fees may apply). Open your FXOpen account now or learn more about trading forex with FXOpen.
This article represents the opinion of the Companies operating under the FXOpen brand only. It is not to be construed as an offer, solicitation, or recommendation with respect to products and services provided by the Companies operating under the FXOpen brand, nor is it to be considered financial advice.
Stay ahead of the market!
Subscribe now to our mailing list and receive the latest market news and insights delivered directly to your inbox.


Latest articles

Weekend Trading: Market Access, Liquidity, and Trading Conditions
Weekend trading refers to market activity outside

AUD/USD Falls Below Key Support
As the AUD/USD chart indicates, the Australian dollar is showing weakness against the US dollar at the start of the week. Notably, we are seeing a bearish breakout below the lower boundary of an important ascending channel that had

Gold Price Falls to 2026 Low
As the XAU/USD chart indicates, today, shortly after the start of the trading week, gold fell below $4,150 (the low of the year). The last time prices were at this level was in early December 2025, before the