


FXOpen

EUR/USD is recovering losses from the 1.0335 zone. USD/JPY is declining and showing bearish signs below the 154.00 level.
Important Takeaways for EUR/USD and USD/JPY Analysis Today
· The Euro struggled to start a fresh increase and declined below the 1.0500 zone.
· There is a key contracting triangle forming with resistance at 1.0500 on the hourly chart of EUR/USD at FXOpen.
· USD/JPY is trading in a bearish zone below the 155.00 and 154.00 levels.
· There is a major bearish trend line forming with resistance near 153.60 on the hourly chart at FXOpen.
EUR/USD Technical Analysis
On the hourly chart of EUR/USD at FXOpen, the pair started a fresh decline from the 1.0610 zone. The Euro declined below the 1.0550 and 1.0500 levels against the US Dollar.
The pair even declined below 1.0400 and the 50-hour simple moving average. Finally, it tested the 1.0335 zone. A low was formed at 1.0332 and the pair is now recovering losses. There was a move above the 1.0400 level.
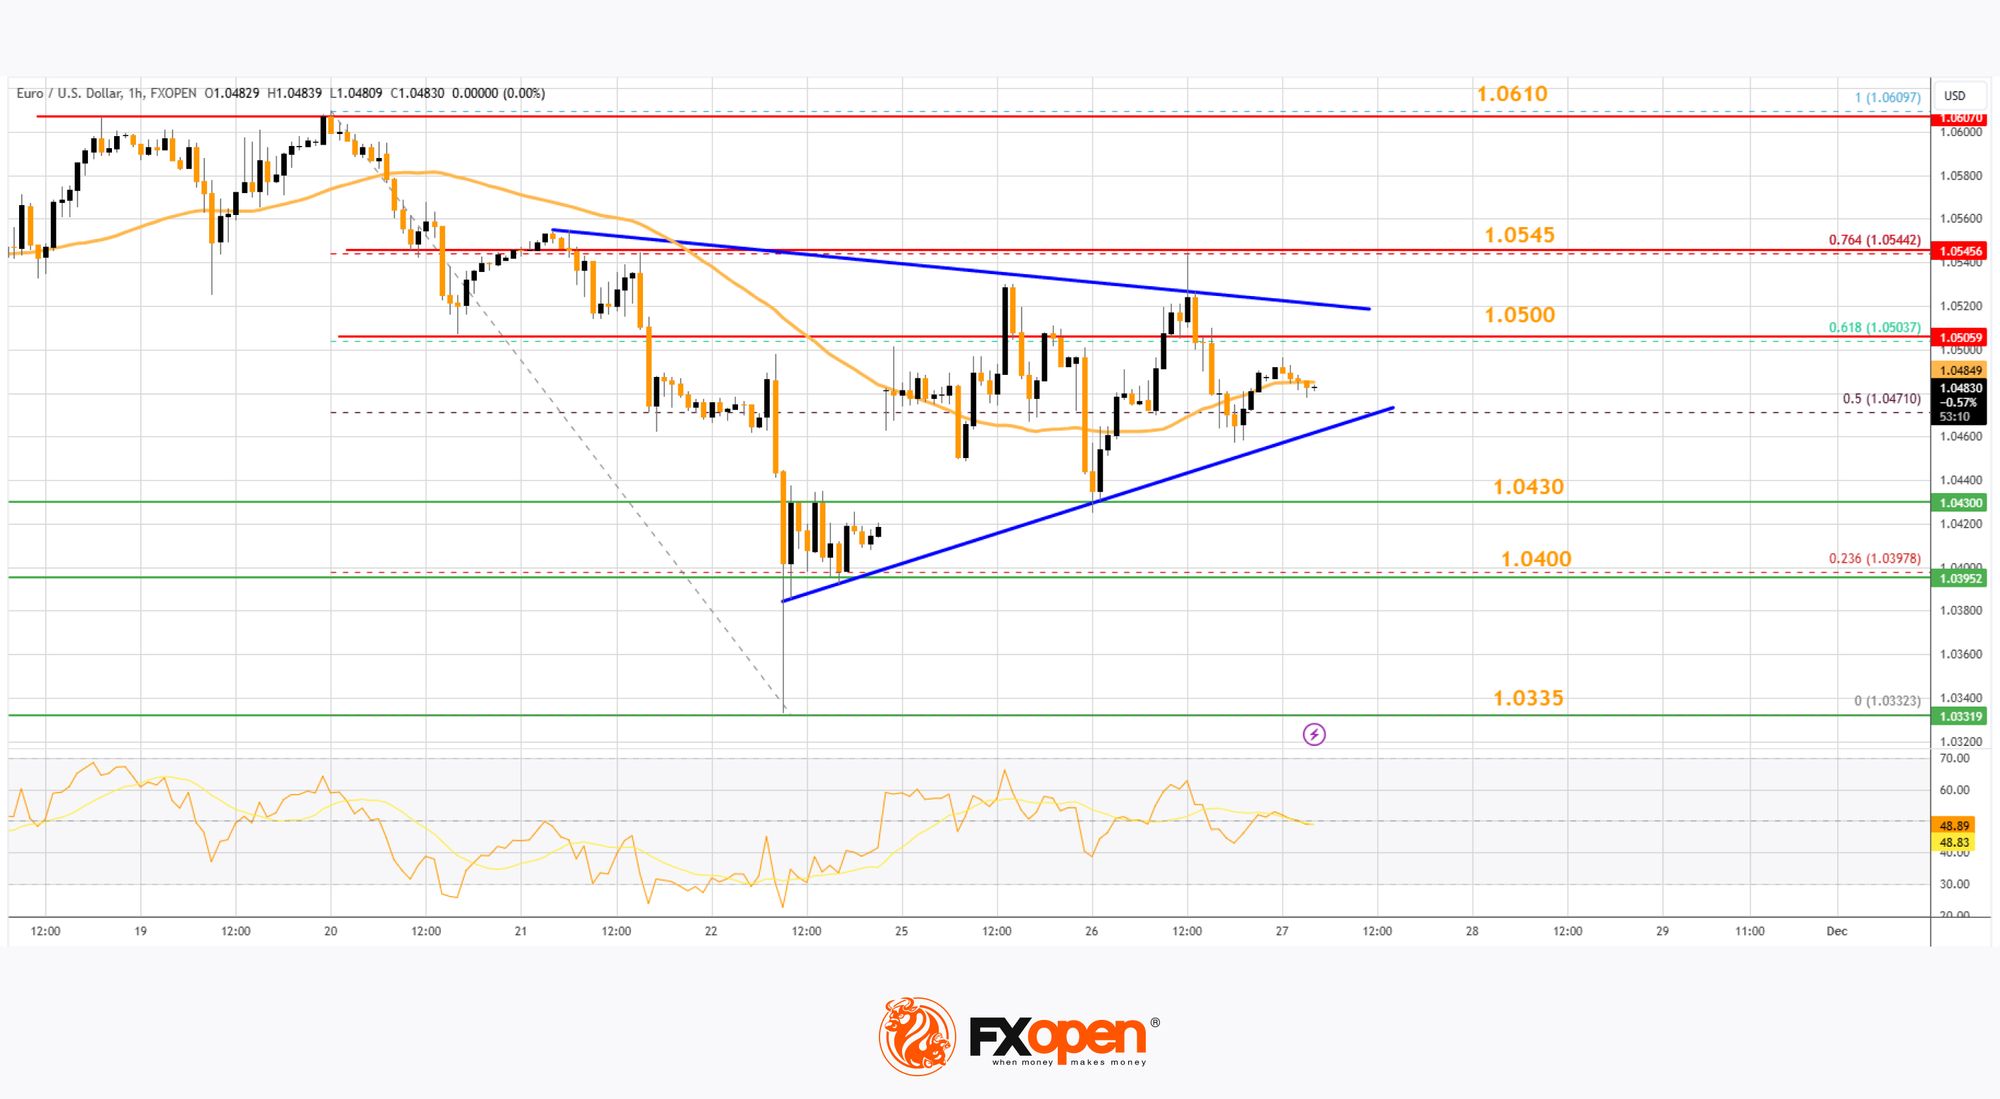
The pair surpassed the 50% Fib retracement level of the downward move from the 1.0609 swing high to the 1.0332 low. On the upside, the pair is now facing resistance near 1.0500.
There is also a key contracting triangle forming with resistance at 1.0500. The next major resistance is near the 76.4% Fib retracement level of the downward move from the 1.0609 swing high to the 1.0332 low at 1.0545.
An upside break above 1.0545 could set the pace for another increase. In the stated case, the pair might rise toward 1.0610. Immediate support is near the 1.0430 level.
The next major support is at 1.0400. If there is a downside break below 1.0400, the pair could drop toward the 1.0335 support. The main support on the EUR/USD chart is near 1.0320, below which the pair could start a major decline.
USD/JPY Technical Analysis
On the hourly chart of USD/JPY at FXOpen, the pair started a steady decline from well above the 155.00 zone. The US Dollar gained bearish momentum below the 154.00 support against the Japanese Yen.
The pair even settled below the 153.60 level and the 50-hour simple moving average. A low was formed at 152.33 and the pair is now showing bearish signs. On the downside, the first major support is near 152.20.
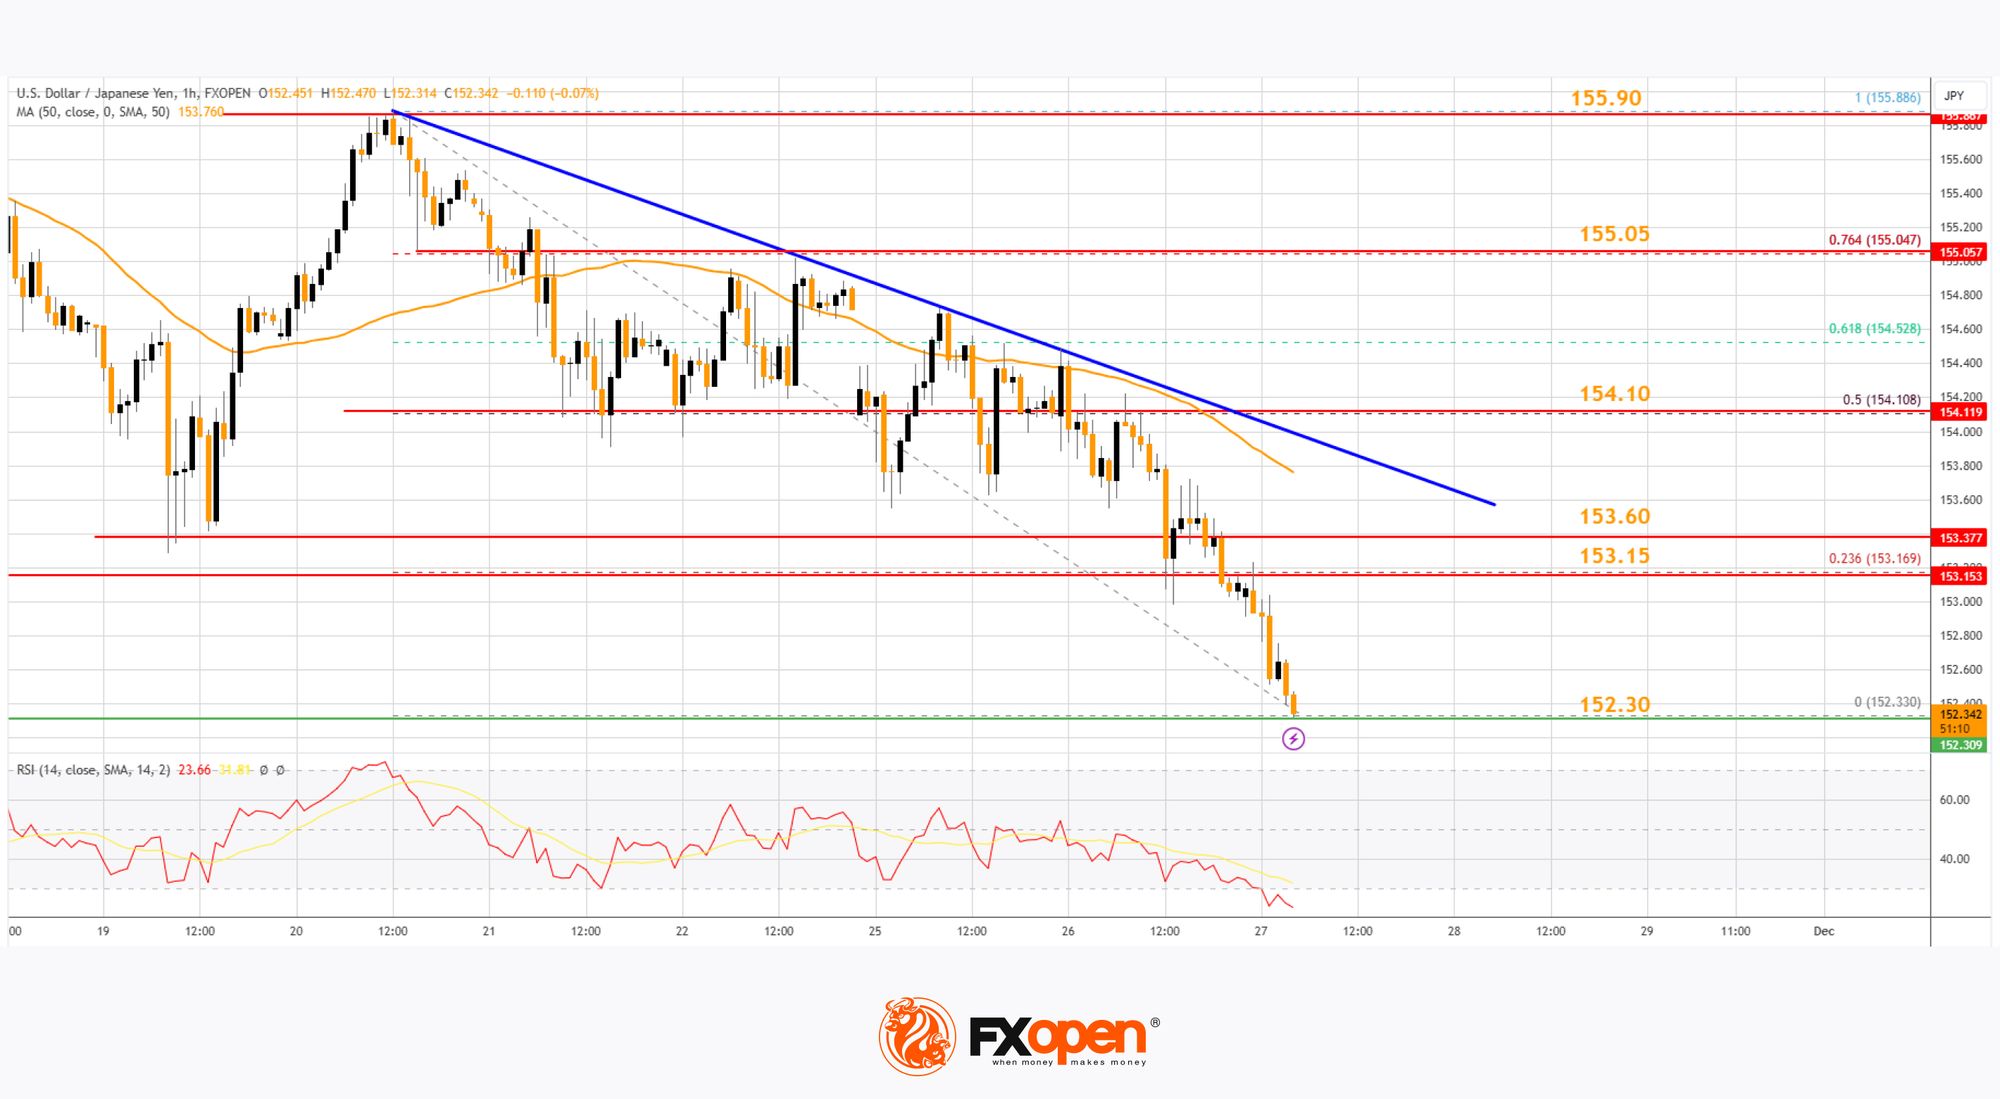
The next major support is near the 151.50 level. If there is a close below 151.50, the pair could decline steadily. In the stated case, the pair might drop toward the 150.00 support. Any more losses might send the pair toward 148.00.
Immediate resistance on the USD/JPY chart is near the 23.6% Fib retracement level of the downward move from the 155.88 swing high to the 152.33 low.
The first major resistance is near a bearish trend line at 153.60. If there is a close above the 153.60 level and the hourly RSI moves above 50, the pair could rise toward 154.10 or the 50% Fib retracement level of the downward move from the 155.88 swing high to the 152.33 low.
The next major resistance is near 155.05, above which the pair could test 155.00 in the coming days.
Trade over 50 forex markets 24 hours a day with FXOpen. Take advantage of low commissions, deep liquidity, and spreads from 0.0 pips (additional fees may apply). Open your FXOpen account now or learn more about trading forex with FXOpen.
This article represents the opinion of the Companies operating under the FXOpen brand only. It is not to be construed as an offer, solicitation, or recommendation with respect to products and services provided by the Companies operating under the FXOpen brand, nor is it to be considered financial advice.
Stay ahead of the market!
Subscribe now to our mailing list and receive the latest market news and insights delivered directly to your inbox.


Latest articles

Market Analysis: GBP/USD Dips Further As EUR/GBP Regains Traction
GBP/USD failed to climb above 1.3500 and corrected some gains. EUR/GBP started a decent increase and might aim for more gains above 0.8700.
Important Takeaways for GBP/USD and EUR/GBP Analysis Today
· The British Pound


Market Insights with Gary Thomson: Oil, US Retail Sales & NFP in Focus
In this video, we’ll explore the key economic events and market trends, shaping the financial landscape. Get ready for insights into financial markets to help you navigate the week ahead. Let’s dive in!
In this episode of Market