


FXOpen

EUR/USD is again moving lower below the 1.0615 support. USD/JPY surged and broke the 151.00 resistance zone.
Important Takeaways for EUR/USD and USD/JPY Analysis Today
· The Euro started a fresh decline below the 1.0675 support zone.
· There was a break below a key bullish trend line with support at 1.0570 on the hourly chart of EUR/USD at FXOpen.
· USD/JPY climbed higher above the 150.00 and 151.00 levels.
· There was a break above a major bearish trend line with resistance at 149.85 on the hourly chart at FXOpen.
EUR/USD Technical Analysis
On the hourly chart of EUR/USD at FXOpen, the pair remained in a bearish zone below the 1.0700 level, as mentioned in the previous analysis. The Euro declined below the 1.0615 support zone against the US Dollar.
The pair even settled below the 1.0595 zone and the 50-hour simple moving average. More importantly, there was a break below a key bullish trend line with support at 1.0570. A low is formed near 1.0557 and the pair is now consolidating losses.
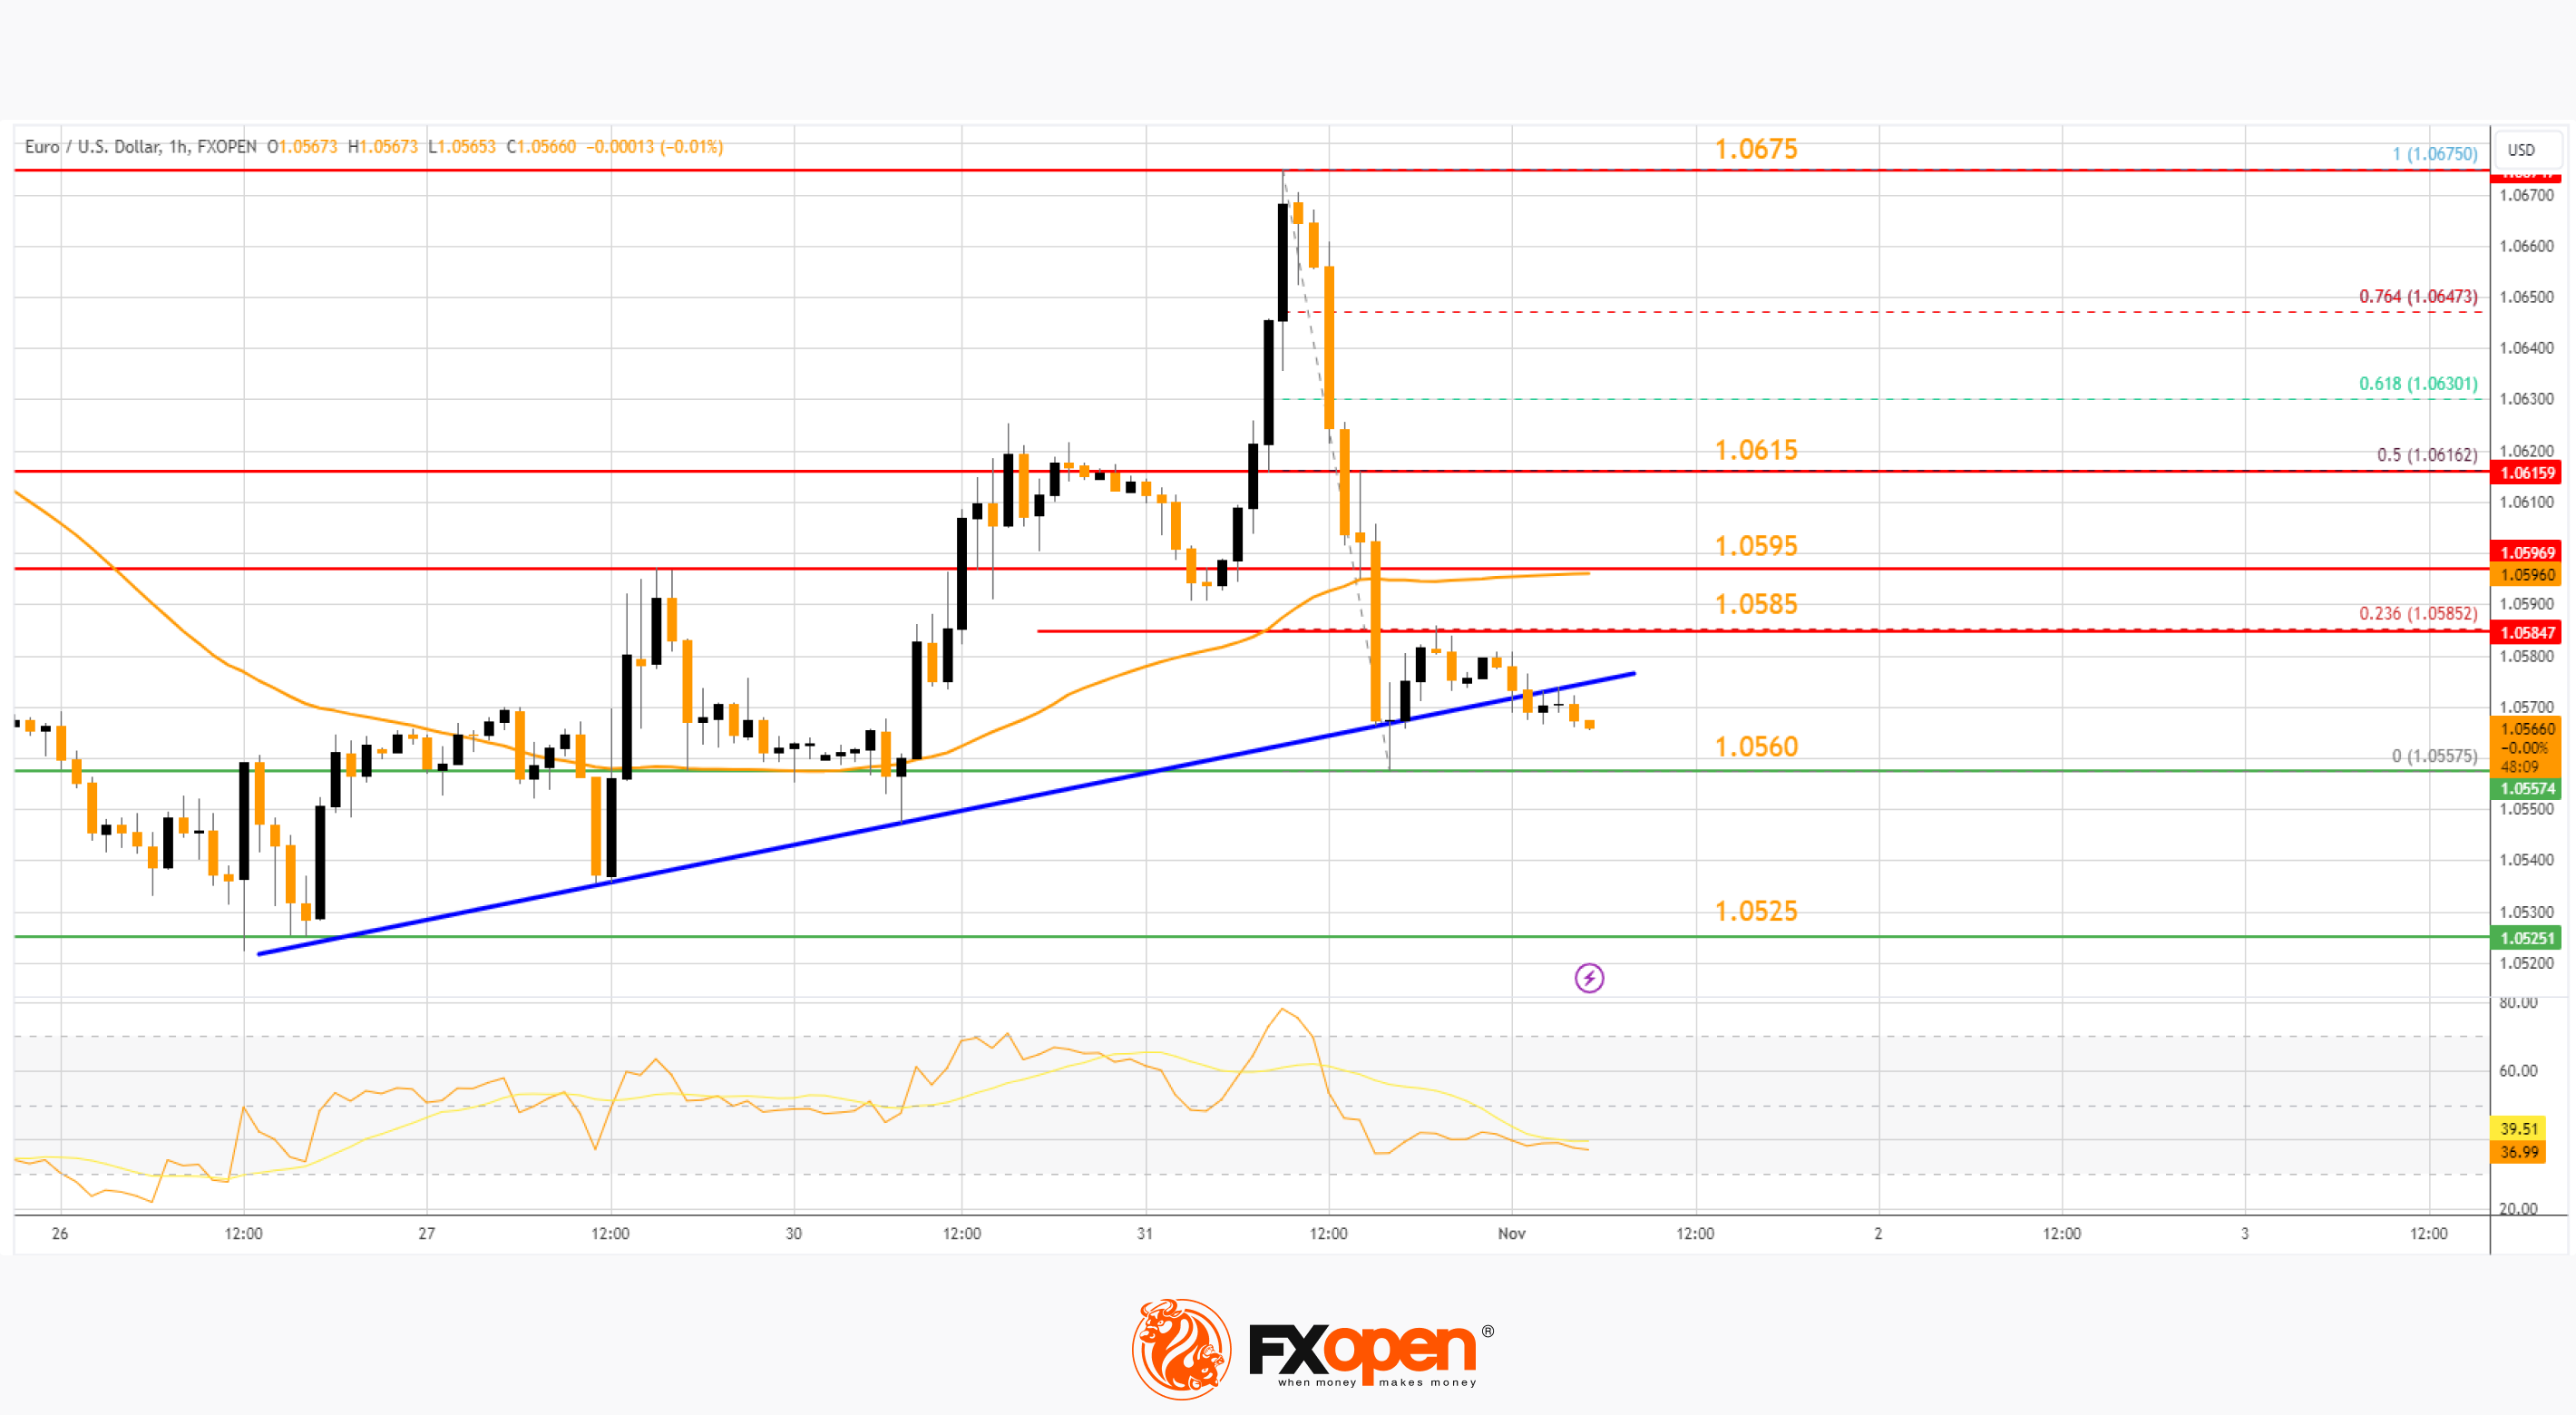
On the upside, the pair is now facing resistance near the 23.6% Fib retracement level of the recent decline from the 1.0675 swing high to the 1.0557 low at 1.0585.
The next key resistance is near the 50-hour simple moving average at 1.0595. The first key resistance is the 50% Fib retracement level of the recent decline from the 1.0675 swing high to the 1.0557 low at 1.0615.
A clear move above the 1.0615 level could send the pair toward the 1.0675 resistance. An upside break above 1.0675 could set the pace for another increase. In the stated case, the pair might rise toward 1.0750.
If not, the pair might resume its decline. The first major support on the EUR/USD chart is near 1.0560. The next key support is at 1.0525. If there is a downside break below 1.0525, the pair could drop toward 1.0500. The next support is near 1.0485, below which the pair could start a major decline.
USD/JPY Technical Analysis
On the hourly chart of USD/JPY at FXOpen, the pair started a strong increase from the 148.80 zone. The US Dollar gained bullish momentum above 150.00 against the Japanese Yen.
It settled above the 50-hour simple moving average and 151.00. However, the pair struggled to clear the 151.75 zone. It is now correcting gains from the 151.70 high. There was a move below the 151.50 level.
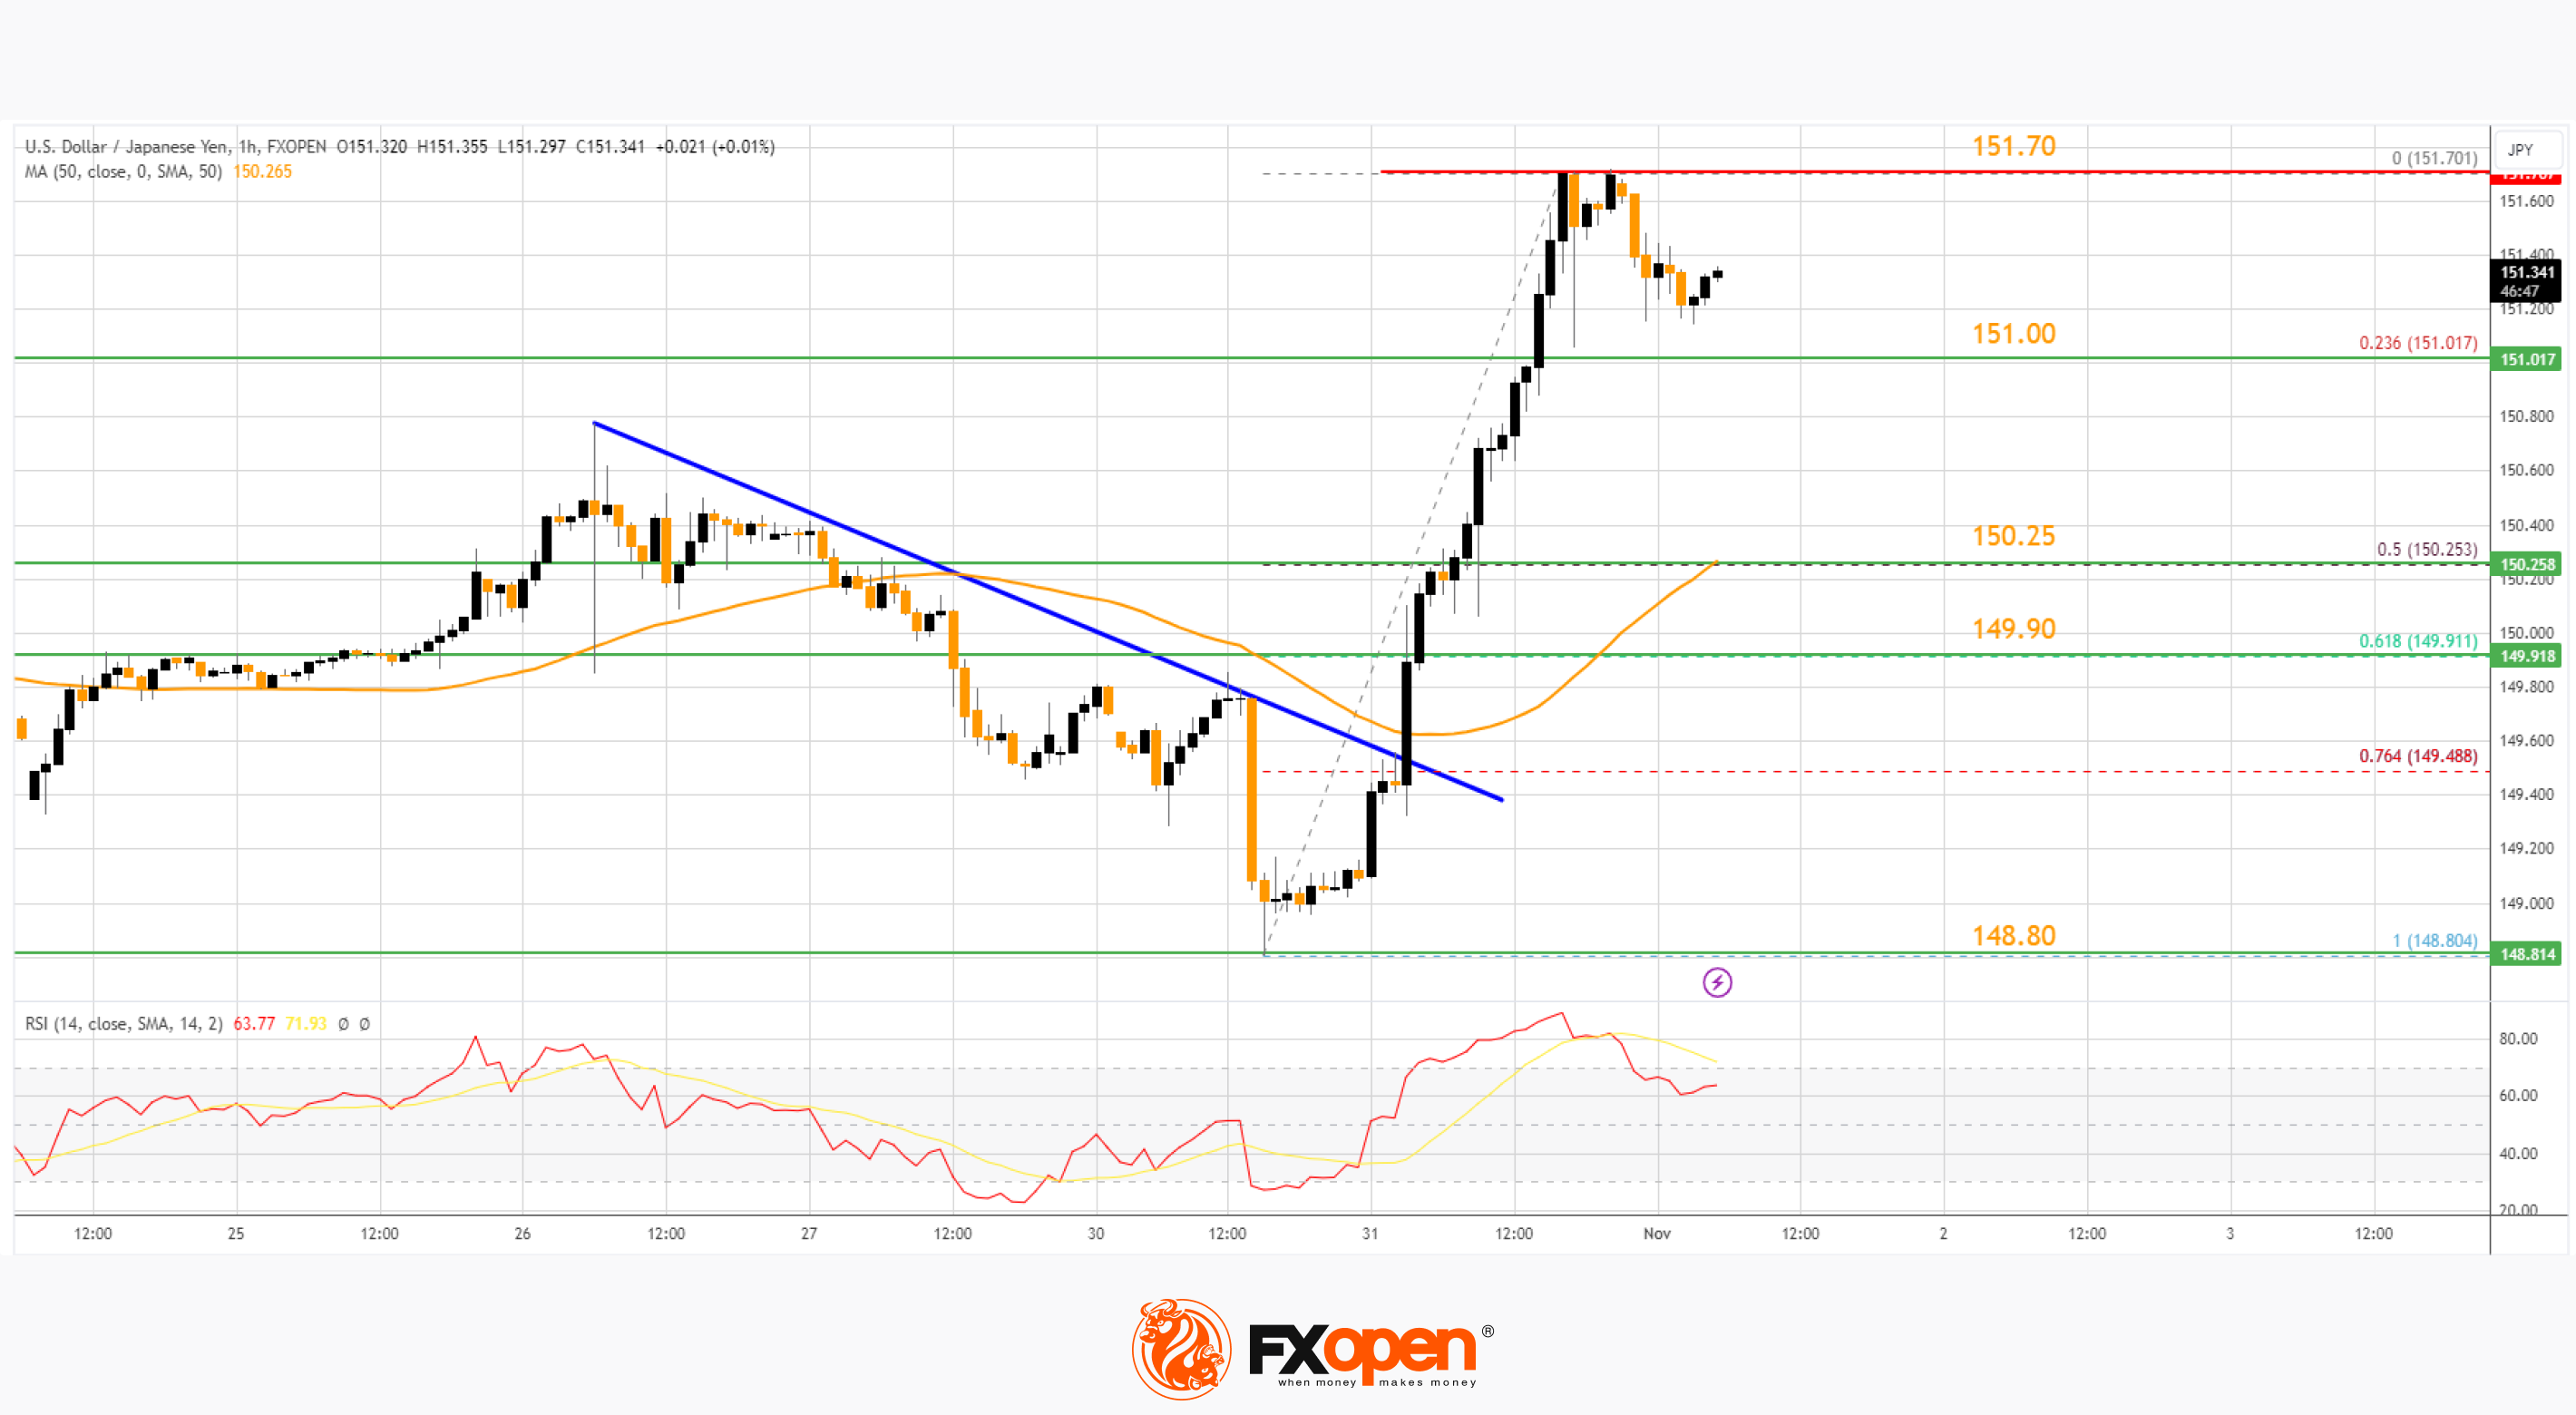
On the downside, the first major support is near the 23.6% Fib retracement level of the upward move from the 148.80 swing low to the 151.70 high. The next major support is near the 50-hour simple moving average at 150.25.
The 50% Fib retracement level of the upward move from the 148.80 swing low to the 151.70 high is also at 150.25. If there is a close below 150.25, the pair could decline steadily.
In the stated case, the pair might drop toward the 149.90 support zone. The next stop for the bears may perhaps be near the 148.80 region.
Immediate resistance on the USD/JPY chart is near the 151.70 zone. The first major resistance is near 152.00. If there is a close above the 152.00 level and the RSI stays above 50, the pair could rise toward 152.20. The next major resistance is near 154.00, above which the pair could test 155.00 in the coming days.
Trade over 50 forex markets 24 hours a day with FXOpen. Take advantage of low commissions, deep liquidity, and spreads from 0.0 pips (additional fees may apply). Open your FXOpen account now or learn more about trading forex with FXOpen.
This article represents the opinion of the Companies operating under the FXOpen brand only. It is not to be construed as an offer, solicitation, or recommendation with respect to products and services provided by the Companies operating under the FXOpen brand, nor is it to be considered financial advice.
Stay ahead of the market!
Subscribe now to our mailing list and receive the latest market news and insights delivered directly to your inbox.


Latest articles


Market Analysis: AUD/USD And NZD/USD Turn Bullish, Is Rally Set to Extend?
AUD/USD started a fresh increase above 0.6970 and 0.7000. NZD/USD is also rising and might aim for more gains above 0.5850.
Important Takeaways for AUD USD and NZD USD Analysis Today
· The Aussie Dollar started

FOMC Minutes in Focus: USD/JPY and USD/CAD Pull Back from Highs
The US dollar has shifted into a corrective phase following its previous rally, while market participants adopt a wait-and-see approach ahead of the release of the Federal Reserve’s meeting minutes. The weakening of the dollar has already led to