


FXOpen

EUR/USD declined from the 1.1200 resistance and corrected gains. USD/JPY is rising and might gain pace above the 144.65 resistance.
Important Takeaways for EUR/USD and USD/JPY Analysis Today
· The Euro started a fresh decline below the 1.1150 support zone.
· There is a connecting bearish trend line forming with resistance at 1.1070 on the hourly chart of EUR/USD at FXOpen.
· USD/JPY climbed higher above the 142.50 and 143.40 levels.
· There is a connecting bullish trend line forming with support at 143.45 on the hourly chart at FXOpen.
EUR/USD Technical Analysis
On the hourly chart of EUR/USD at FXOpen, the pair struggled to clear the 1.1200 resistance zone. The Euro started a fresh decline and traded below the 1.1150 support zone against the US Dollar.
The pair declined below 1.1125 and tested the 1.1100 zone. A low was formed near 1.1045 and the pair is now consolidating losses. There was a minor recovery wave above the 1.1060 level. On the upside, the pair is now facing resistance near a connecting bearish trend line at 1.1070.
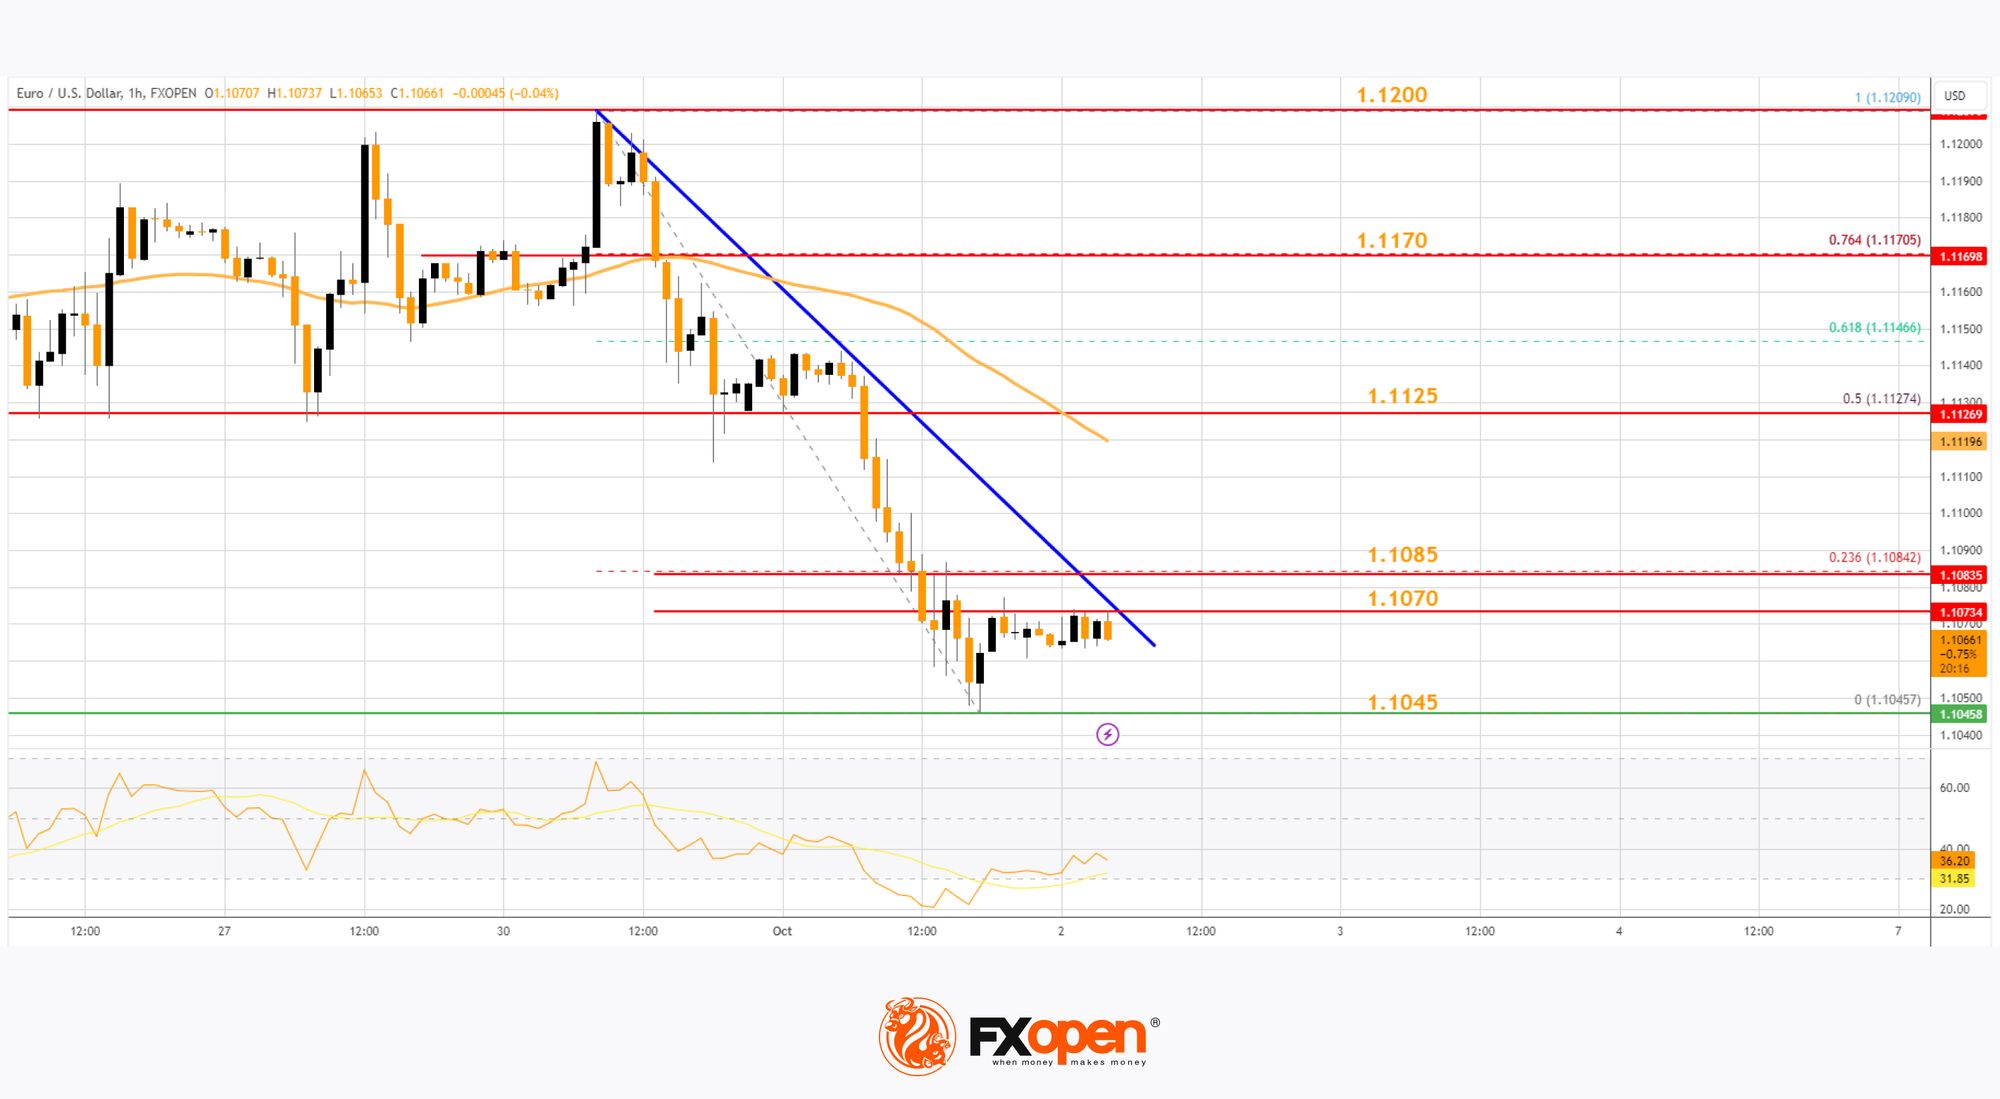
The trend line is close to the 23.6% Fib retracement level of the recent decline from the 1.1209 swing high to the 1.1045 low. The next key resistance is near the 50-hour simple moving average at 1.1125.
The main resistance is near the 76.4% Fib retracement level of the recent decline from the 1.1209 swing high to the 1.1045 low at 1.1170. A clear move above the 1.1170 level could send the pair toward the 1.1200 resistance.
An upside break above 1.1200 could set the pace for another increase. In the stated case, the pair might rise toward 1.1250.
If not, the pair might resume its decline. The first major support on the EUR/USD chart is near 1.1045. The next key support is at 1.1020. If there is a downside break below 1.1020, the pair could drop toward 1.1000. The next support is near 1.0965, below which the pair could start a major decline.
USD/JPY Technical Analysis
On the hourly chart of USD/JPY at FXOpen, the pair started a fresh upward move from the 141.65 zone. The US Dollar gained bullish momentum above 142.80 against the Japanese Yen.
It even cleared the 50-hour simple moving average and 143.00. The bulls pushed the pair above the 143.50 and it tested the 50% Fib retracement level of the downward move from the 146.49 swing high to the 141.65 low.
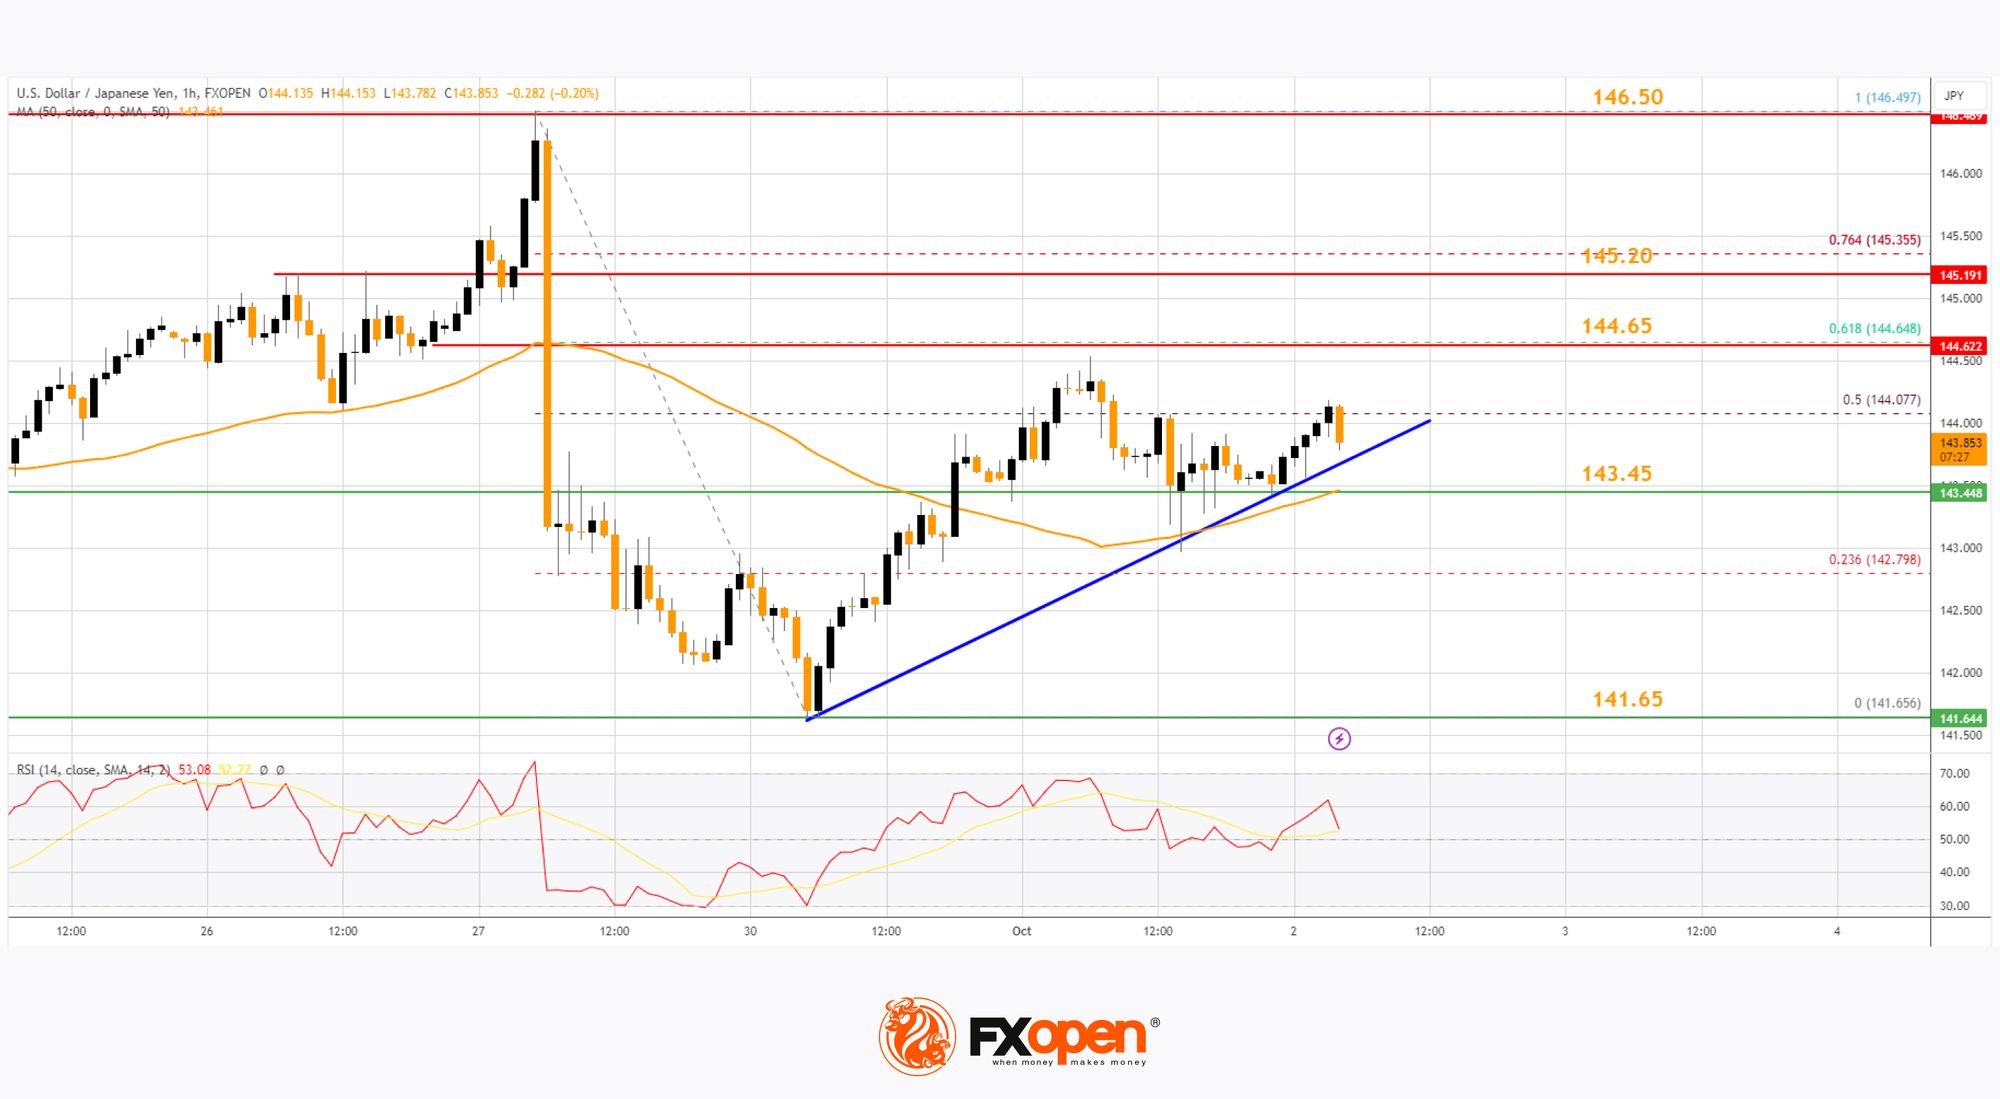
The current price action above the 143.20 level is positive. Immediate resistance on the USD/JPY chart is near 144.65 and the 61.8% Fib retracement level of the downward move from the 146.49 swing high to the 141.65 low.
The first major resistance is near 145.20. If there is a close above the 145.20 level and the RSI moves above 60, the pair could rise toward 146.50. The next major resistance is near 148.00, above which the pair could test 150.00 in the coming days.
On the downside, the first major support is near a connecting bullish trend line with support at 143.45 and the 50-hour simple moving average, below which the bears could gain strength.
The next major support is visible near the 141.65 level. If there is a close below 141.65, the pair could decline steadily. In the stated case, the pair might drop toward the 140.00 support zone. The next stop for the bears may perhaps be near the 138.00 region.
Trade over 50 forex markets 24 hours a day with FXOpen. Take advantage of low commissions, deep liquidity, and spreads from 0.0 pips (additional fees may apply). Open your FXOpen account now or learn more about trading forex with FXOpen.
This article represents the opinion of the Companies operating under the FXOpen brand only. It is not to be construed as an offer, solicitation, or recommendation with respect to products and services provided by the Companies operating under the FXOpen brand, nor is it to be considered financial advice.
Stay ahead of the market!
Subscribe now to our mailing list and receive the latest market news and insights delivered directly to your inbox.


Latest articles

Market Analysis: GBP/USD Dips Further As EUR/GBP Regains Traction
GBP/USD failed to climb above 1.3500 and corrected some gains. EUR/GBP started a decent increase and might aim for more gains above 0.8700.
Important Takeaways for GBP/USD and EUR/GBP Analysis Today
· The British Pound


Market Insights with Gary Thomson: Oil, US Retail Sales & NFP in Focus
In this video, we’ll explore the key economic events and market trends, shaping the financial landscape. Get ready for insights into financial markets to help you navigate the week ahead. Let’s dive in!
In this episode of Market