


FXOpen

GBP/USD is attempting a recovery wave from 1.2680. USD/CAD is rising and might aim for a move above the 1.3690 resistance zone.
Important Takeaways for GBP/USD and USD/CAD Analysis Today
· The British Pound started a fresh decline from the 1.2800 resistance zone.
· There is a key bearish trend line forming with resistance near 1.2740 on the hourly chart of GBP/USD at FXOpen.
· USD/CAD is showing positive signs above the 1.3660 support zone.
· There is a connecting bearish trend line forming with resistance near 1.3690 on the hourly chart at FXOpen.
GBP/USD Technical Analysis
On the hourly chart of GBP/USD at FXOpen, the pair started a fresh decline from the 1.2800 zone after a decent increase, as mentioned in the previous analysis. The British Pound traded below the 1.2740 support to again move into a short-term bearish zone against the US Dollar.
The pair even traded below 1.2710 and the 50-hour simple moving average. Finally, the bulls appeared near the 1.2680 level. A low was formed near 1.2680 and the pair is now attempting a short-term recovery wave.
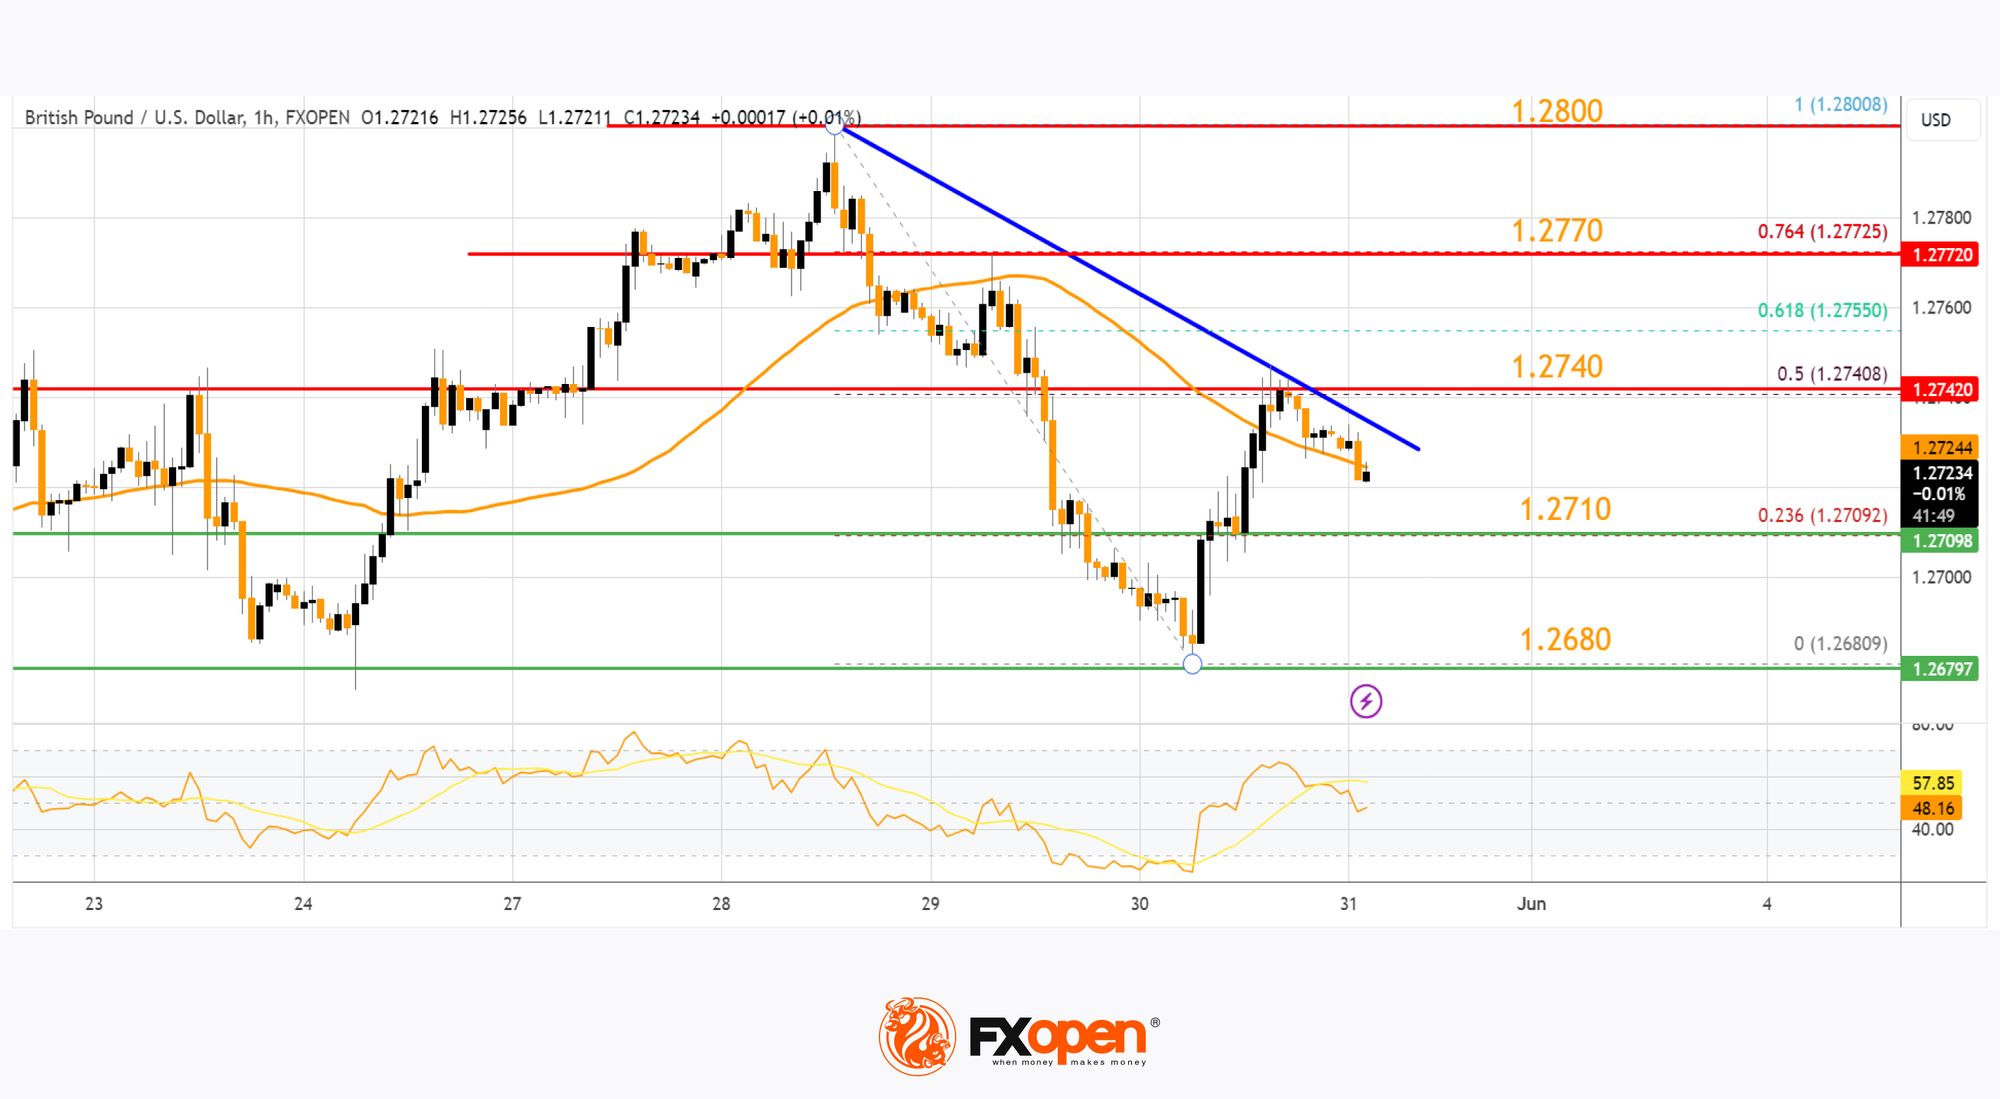
There was a fresh upside above the 1.2710 level. The pair climbed above the 23.6% Fib retracement level of the downward move from the 1.2800 swing high to the 1.2680 low.
Immediate resistance on the upside is near the 50% Fib retracement level of the downward move from the 1.2800 swing high to the 1.2680 low at 1.2740 and the 50-hour simple moving average. There is also a key bearish trend line forming with resistance near 1.2740.
The first major resistance on the GBP/USD chart is near the 1.2770 level. A close above the 1.2770 resistance might spark a decent increase. The next major resistance is near the 1.2800 level. Any more gains could lead the pair toward the 1.2880 resistance in the near term.
Initial support sits near 1.2710. The next major support sits at 1.2680, below which there is a risk of another sharp decline. In the stated case, the pair could drop toward 1.2620.
USD/CAD Technical Analysis
On the hourly chart of USD/CAD at FXOpen, the pair formed a strong support base above the 1.3600 level. The US Dollar started a fresh increase above the 1.3660 resistance against the Canadian Dollar.
The pair cleared the 50-hour simple moving average and climbed above 1.3700. Finally, it tested the 1.3735 zone before there was a downside correction. The pair traded below the 1.3700 support zone. There was a move below the 50% Fib retracement level of the upward move from the 1.3615 swing low to the 1.3734 high.
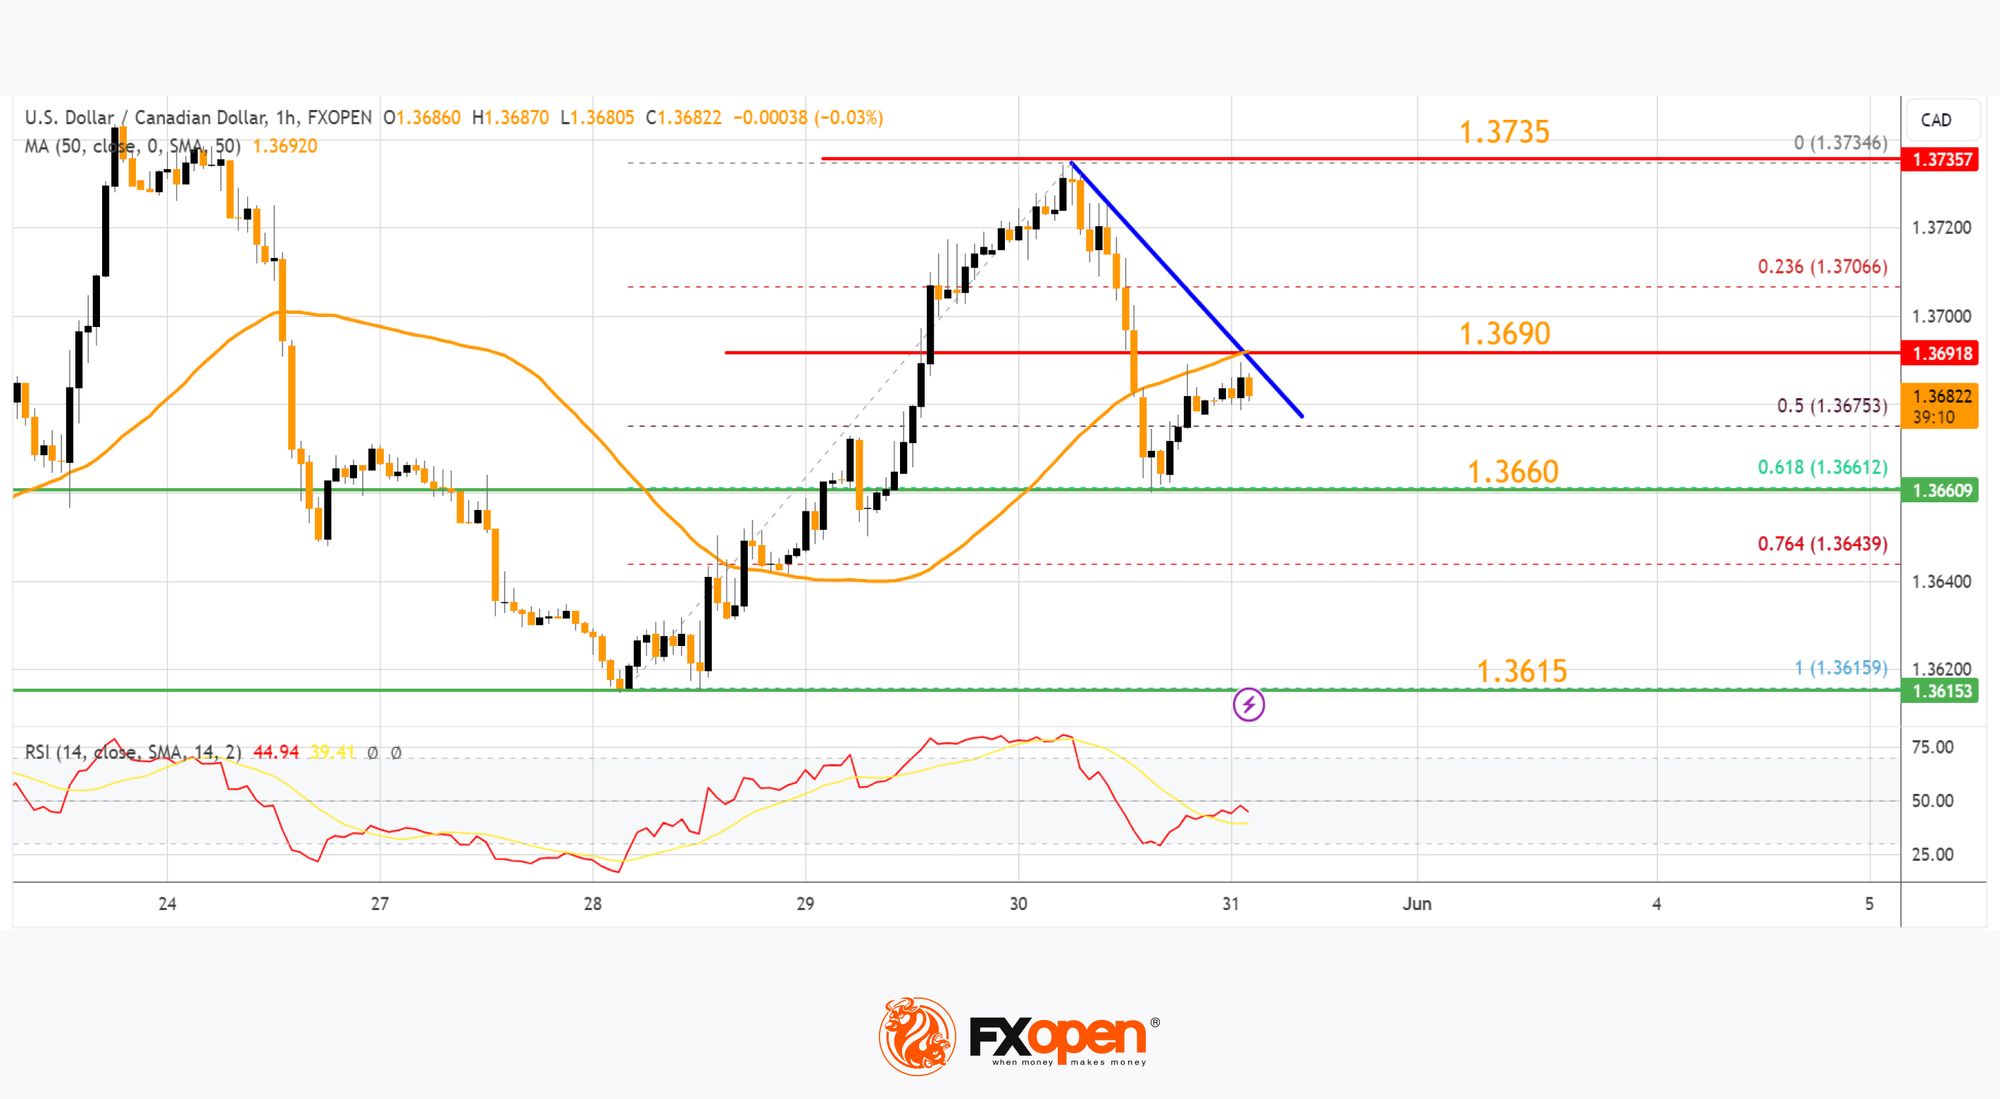
It tested the 1.3660 support zone and the 61.8% Fib retracement level of the upward move from the 1.3615 swing low to the 1.3734 high. The pair is again rising above the 1.3675 level.
Initial resistance sits near the 1.3690 level and the 50-hour simple moving average. There is also a connecting bearish trend line forming with resistance near 1.3690. A clear upside break above 1.3690 could start another steady increase.
The next major resistance is the 1.3735 level. A close above the 1.3735 level might send the pair toward the 1.3800 level. Any more gains could open the doors for a test of the 1.3850 level.
Conversely, the pair could start another decline. Initial support is near the 1.3660 level on the same USD/CAD chart. The next major support is near 1.3615. A downside break below the 1.3615 level could push the pair further lower. The next major support is near the 1.3550 support zone, below which the pair might visit 1.3500.
Trade over 50 forex markets 24 hours a day with FXOpen. Take advantage of low commissions, deep liquidity, and spreads from 0.0 pips (additional fees may apply). Open your FXOpen account now or learn more about trading forex with FXOpen.
This article represents the opinion of the Companies operating under the FXOpen brand only. It is not to be construed as an offer, solicitation, or recommendation with respect to products and services provided by the Companies operating under the FXOpen brand, nor is it to be considered financial advice.
Stay ahead of the market!
Subscribe now to our mailing list and receive the latest market news and insights delivered directly to your inbox.


Latest articles

Weak Data Weigh on the Dollar: Market Awaits Trend Confirmation
The US dollar is retreating from recent highs, moving into a moderate correction after a prolonged period of gains. Pressure on the currency is building amid weaker-than-expected macroeconomic data, while market participants adopt a wait-and-see approach ahead of key labour

Market Analysis: EUR/USD Aims Recovery While USD/JPY Gives Back Recent Gains
EUR/USD is recovering losses from 1.1450. USD/JPY is correcting gains from 160.50 and might decline further below 158.00.
Important Takeaways for EUR/USD and USD/JPY Analysis Today
· The Euro struggled to stay in a

European Currencies Decline: Pound Hits New Lows, Euro Under Pressure
European currencies continue to weaken against the US dollar amid rising geopolitical tensions and increased demand for safe-haven and liquid assets. Market participants are reducing exposure to riskier instruments, putting pressure on both the euro and the pound. Additional support