


Market Analysis: GBP/USD Dives While USD/CAD Gains Bullish Pace
FXOpen
GBP/USD declined below the 1.2665 support zone. USD/CAD is rising and might aim for more gains above the 1.3610 resistance.
Important Takeaways for GBP/USD and USD/CAD Analysis Today
· The British Pound started a fresh decline from the 1.2800 resistance zone.
· There was a break below a key rising channel with support at 1.2630 on the hourly chart of GBP/USD at FXOpen.
· USD/CAD is showing positive signs above the 1.3555 support zone.
· There was a break above a major bearish trend line with resistance near 1.3575 on the hourly chart at FXOpen.
GBP/USD Technical Analysis
On the hourly chart of GBP/USD at FXOpen, the pair started a fresh decline from the 1.2800 zone. The British Pound traded below the 1.2690 support to move into further a bearish zone against the US Dollar.
The pair even traded below 1.2665 and the 50-hour simple moving average. Finally, the bulls appeared near the 1.2580 level. A low was formed at 1.2575 and the pair recently attempted a recovery wave. The pair climbed above the 1.2600 level.
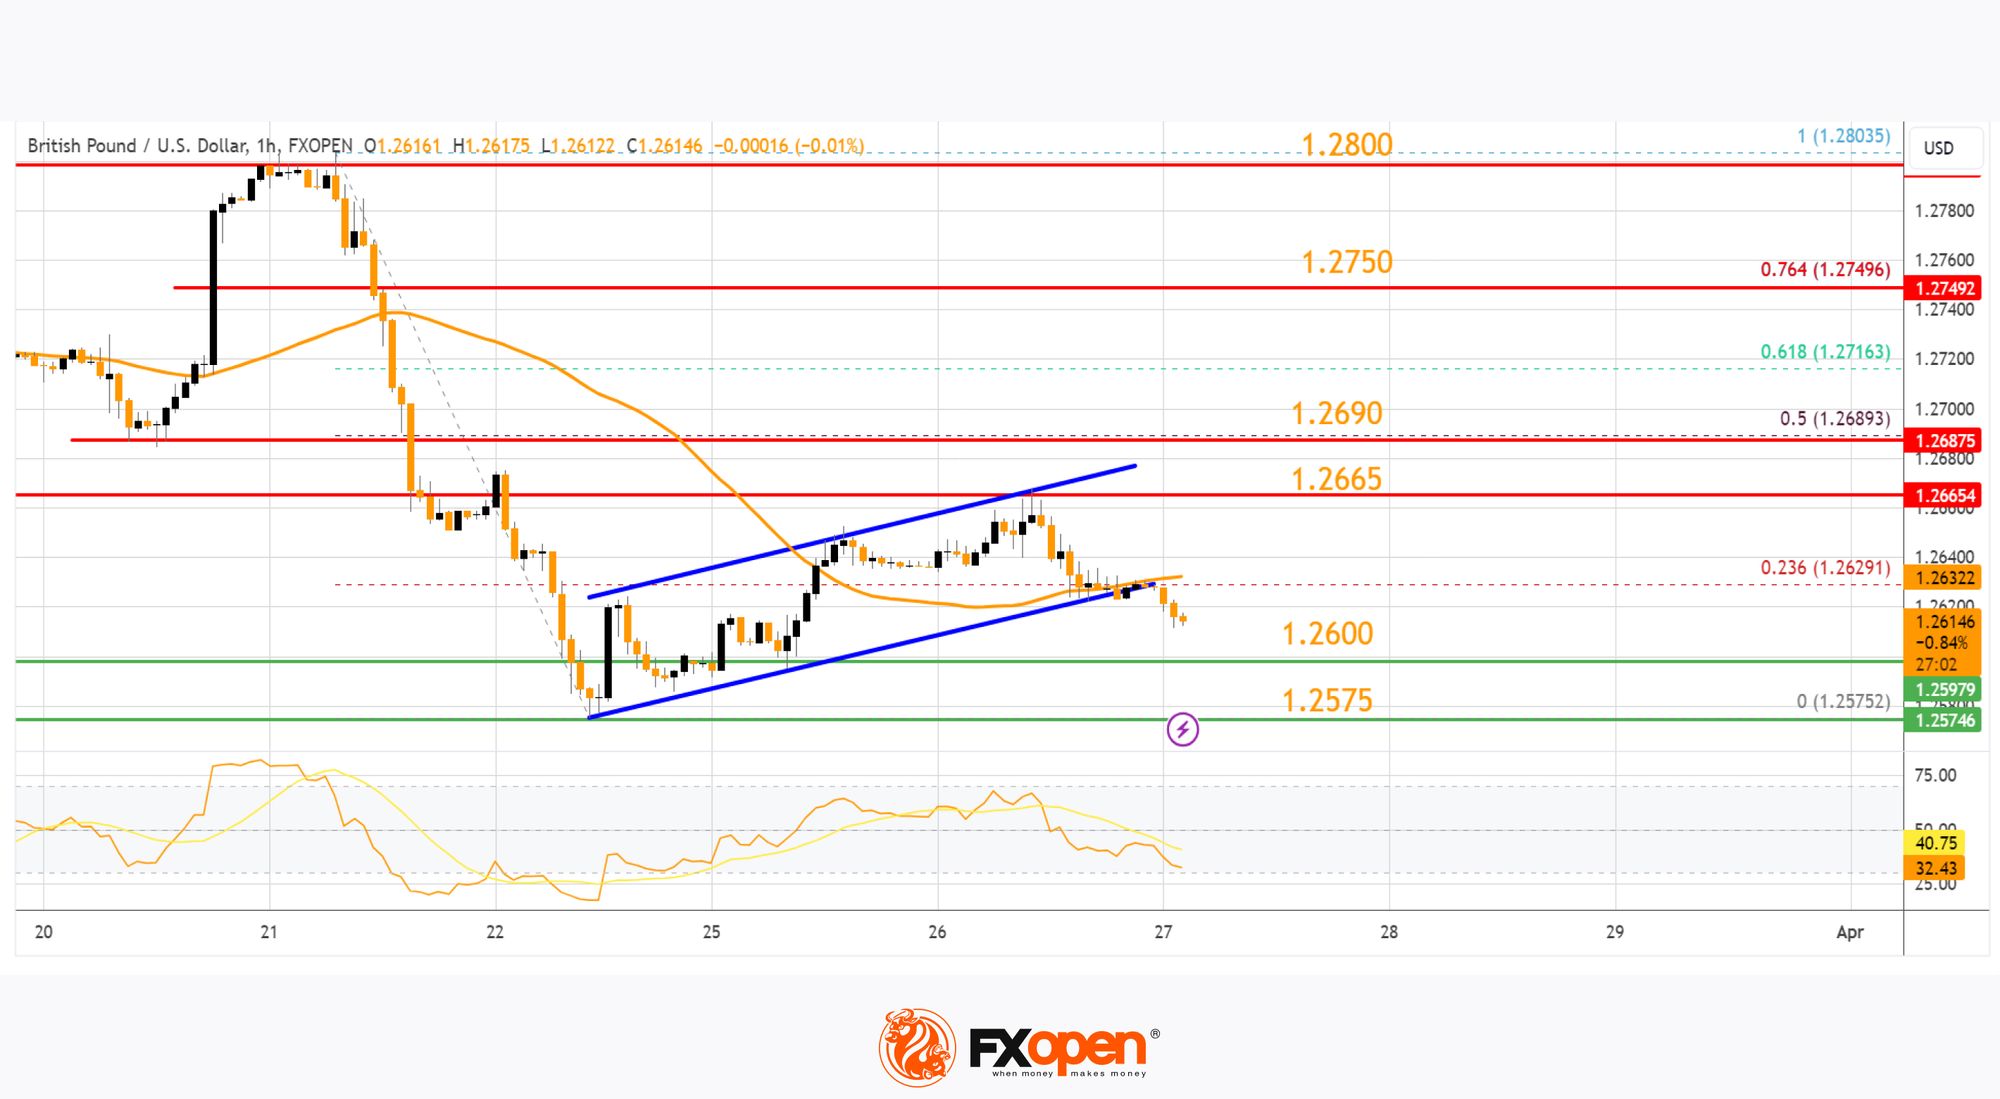
It cleared the 23.6% Fib retracement level of the downward move from the 1.2803 swing high to the 1.2575 low. However, the bears were active near 1.2665 and pushed the pair lower again.
There was a break below a key rising channel with support at 1.2630. Initial support on the GBP/USD chart sits at 1.2600. The next major support sits at 1.2575, below which there is a risk of another sharp decline. In the stated case, the pair could drop toward 1.2500.
Immediate resistance on the upside is near the 1.2665 level. The first major resistance is near the 50% Fib retracement level of the downward move from the 1.2803 swing high to the 1.2575 low at 1.2690.
A close above the 1.2690 resistance might spark a steady upward move. The next major resistance is near the 1.2750. Any more gains could lead the pair toward the 1.2800 resistance in the near term.
USD/CAD Technical Analysis
On the hourly chart of USD/CAD at FXOpen, the pair formed a strong support base above the 1.3445 level. The US Dollar started a fresh increase above the 1.3515 resistance against the Canadian Dollar.
The bulls pushed the pair above the 50% Fib retracement level of the main decline from the 1.3613 swing high to the 1.3552 low. There was a break above a major bearish trend line with resistance near 1.3575.
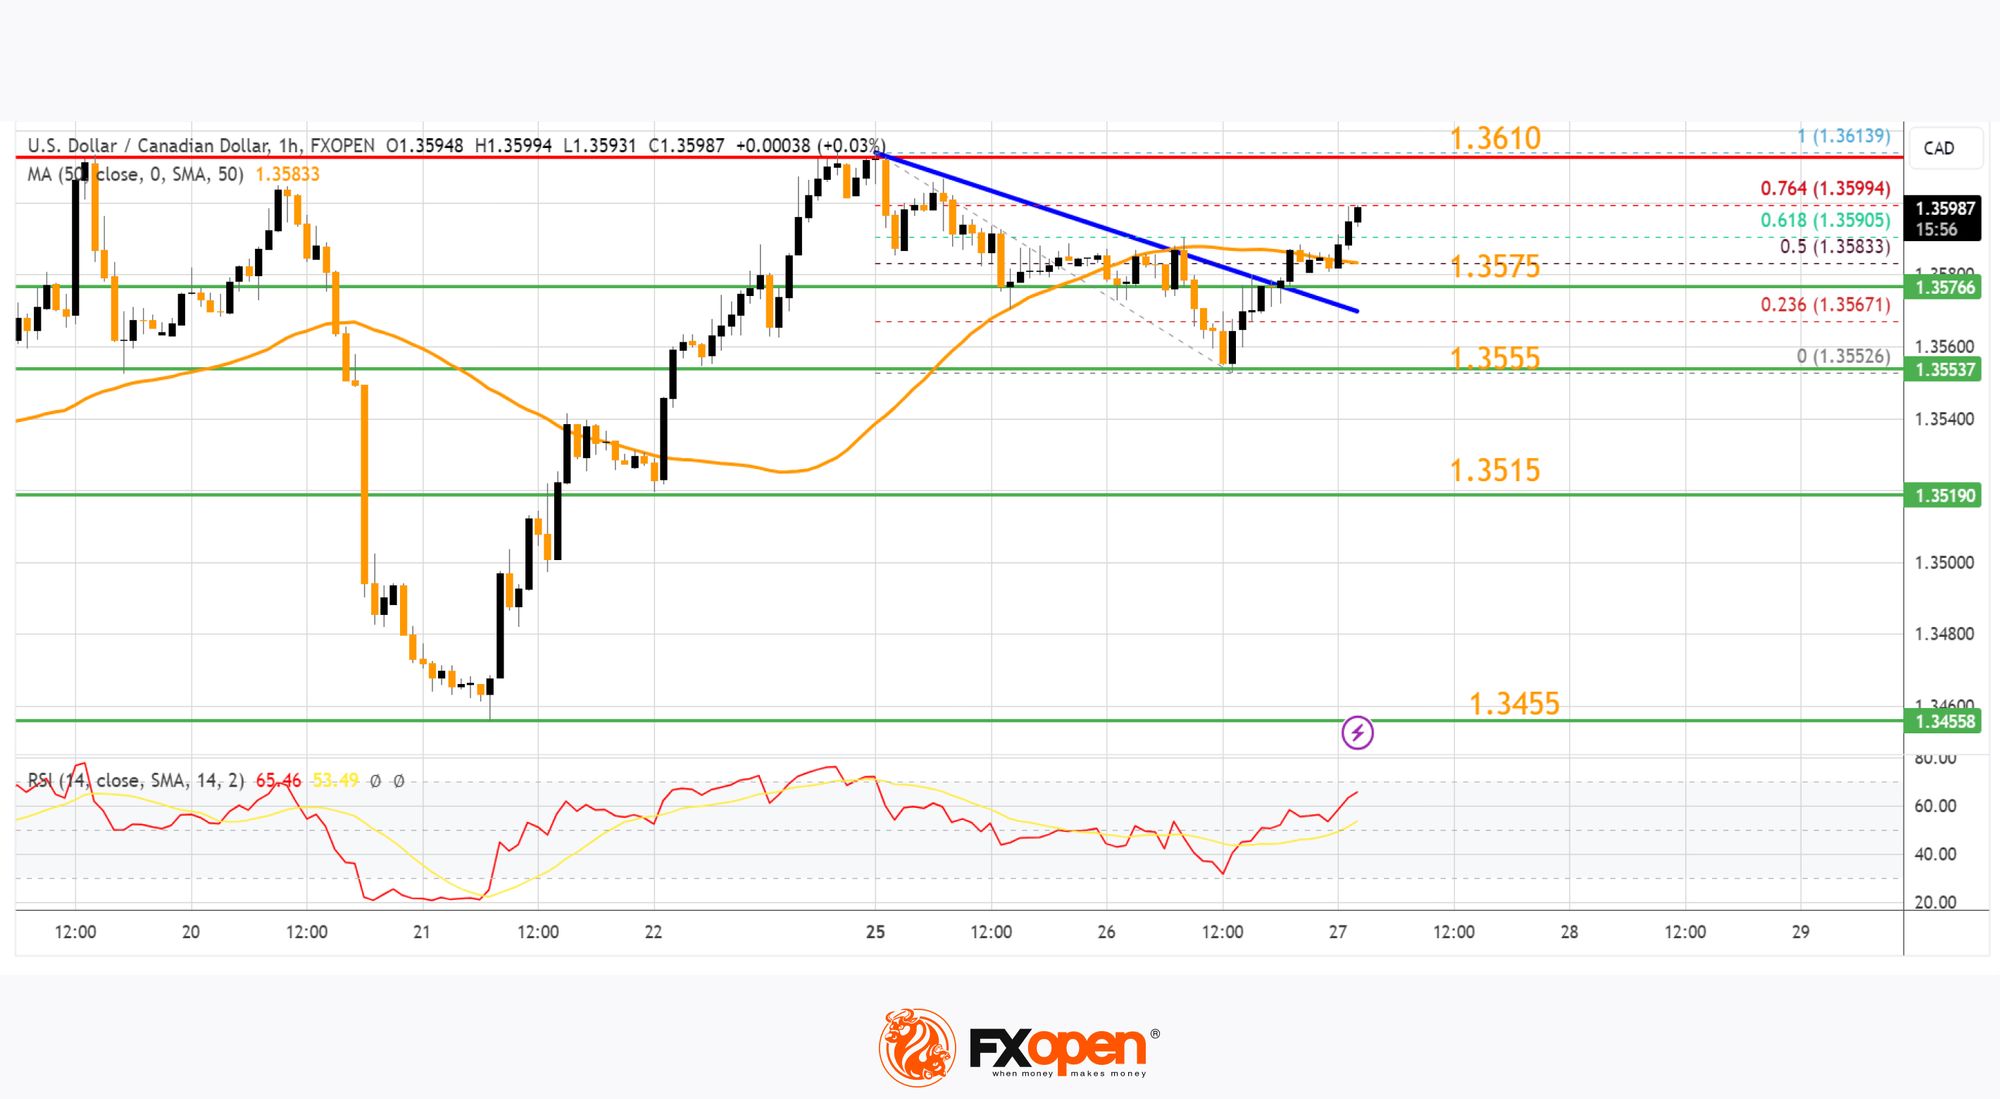
The pair cleared the 50-hour simple moving average and climbed above 1.3590. It is now consolidating near the 76.4% Fib retracement level of the main decline from the 1.3613 swing high to the 1.3552 low. Initial resistance sits near the 1.3610 zone.
A clear upside break above 1.3610 could start another steady increase. The next major resistance is the 1.3640 level. A close above the 1.3640 level might send the pair toward the 1.3700 level. Any more gains could open the doors for a test of the 1.3750 level.
Initial support is near the 50-hour simple moving average and 1.3575. The next major support is near 1.3555 on the same USD/CAD chart.
The main support sits near 1.3515. A downside break below the 1.3515 level could push the pair further lower. The next major support is near the 1.3455 support zone, below which the pair might visit 1.3400.
Trade over 50 forex markets 24 hours a day with FXOpen. Take advantage of low commissions, deep liquidity, and spreads from 0.0 pips (additional fees may apply). Open your FXOpen account now or learn more about trading forex with FXOpen.
This article represents the opinion of the Companies operating under the FXOpen brand only. It is not to be construed as an offer, solicitation, or recommendation with respect to products and services provided by the Companies operating under the FXOpen brand, nor is it to be considered financial advice.
Stay ahead of the market!
Subscribe now to our mailing list and receive the latest market news and insights delivered directly to your inbox.


Latest articles

EUR/USD Analysis: Who Is in Control?
Two central banks, two hawkish tones — but only one dollar just took a hit. The ECB delivered a 25bp hike in June, its first since 2023, lifting the deposit rate to 2.25% as Middle East-driven energy costs pushed headline

Gold Resumes Its Advance Following the US Labour Market Report
Gold is attempting to break its medium-term trend, with the latest US labour market data acting as the main catalyst. The US employment report released on 2 July came in noticeably weaker than expected, with the pace of hiring slowing

NZD/CHF Analysis: Which Currency Breaks the Consolidation First?
NZD/CHF remains locked in a tight range as traders await the next monetary policy catalyst.
The Reserve Bank of New Zealand heads into Wednesday's meeting on shaky ground. After May's 3-3 split was resolved by a casting vote, the