


FXOpen

GBP/USD is gaining pace above the 1.2900 resistance. EUR/GBP declined and is now consolidating losses above the 0.8400 region.
Important Takeaways for GBP/USD and EUR/GBP Analysis Today
- The British Pound is attempting a fresh increase above 1.2950.
- There is a key bullish trend line forming with support near 1.2910 on the hourly chart of GBP/USD at FXOpen.
- EUR/GBP is trading in a bearish zone below the 0.8440 pivot level.
- There was a break above a connecting bearish trend line with resistance near 0.8425 on the hourly chart at FXOpen.
GBP/USD Technical Analysis
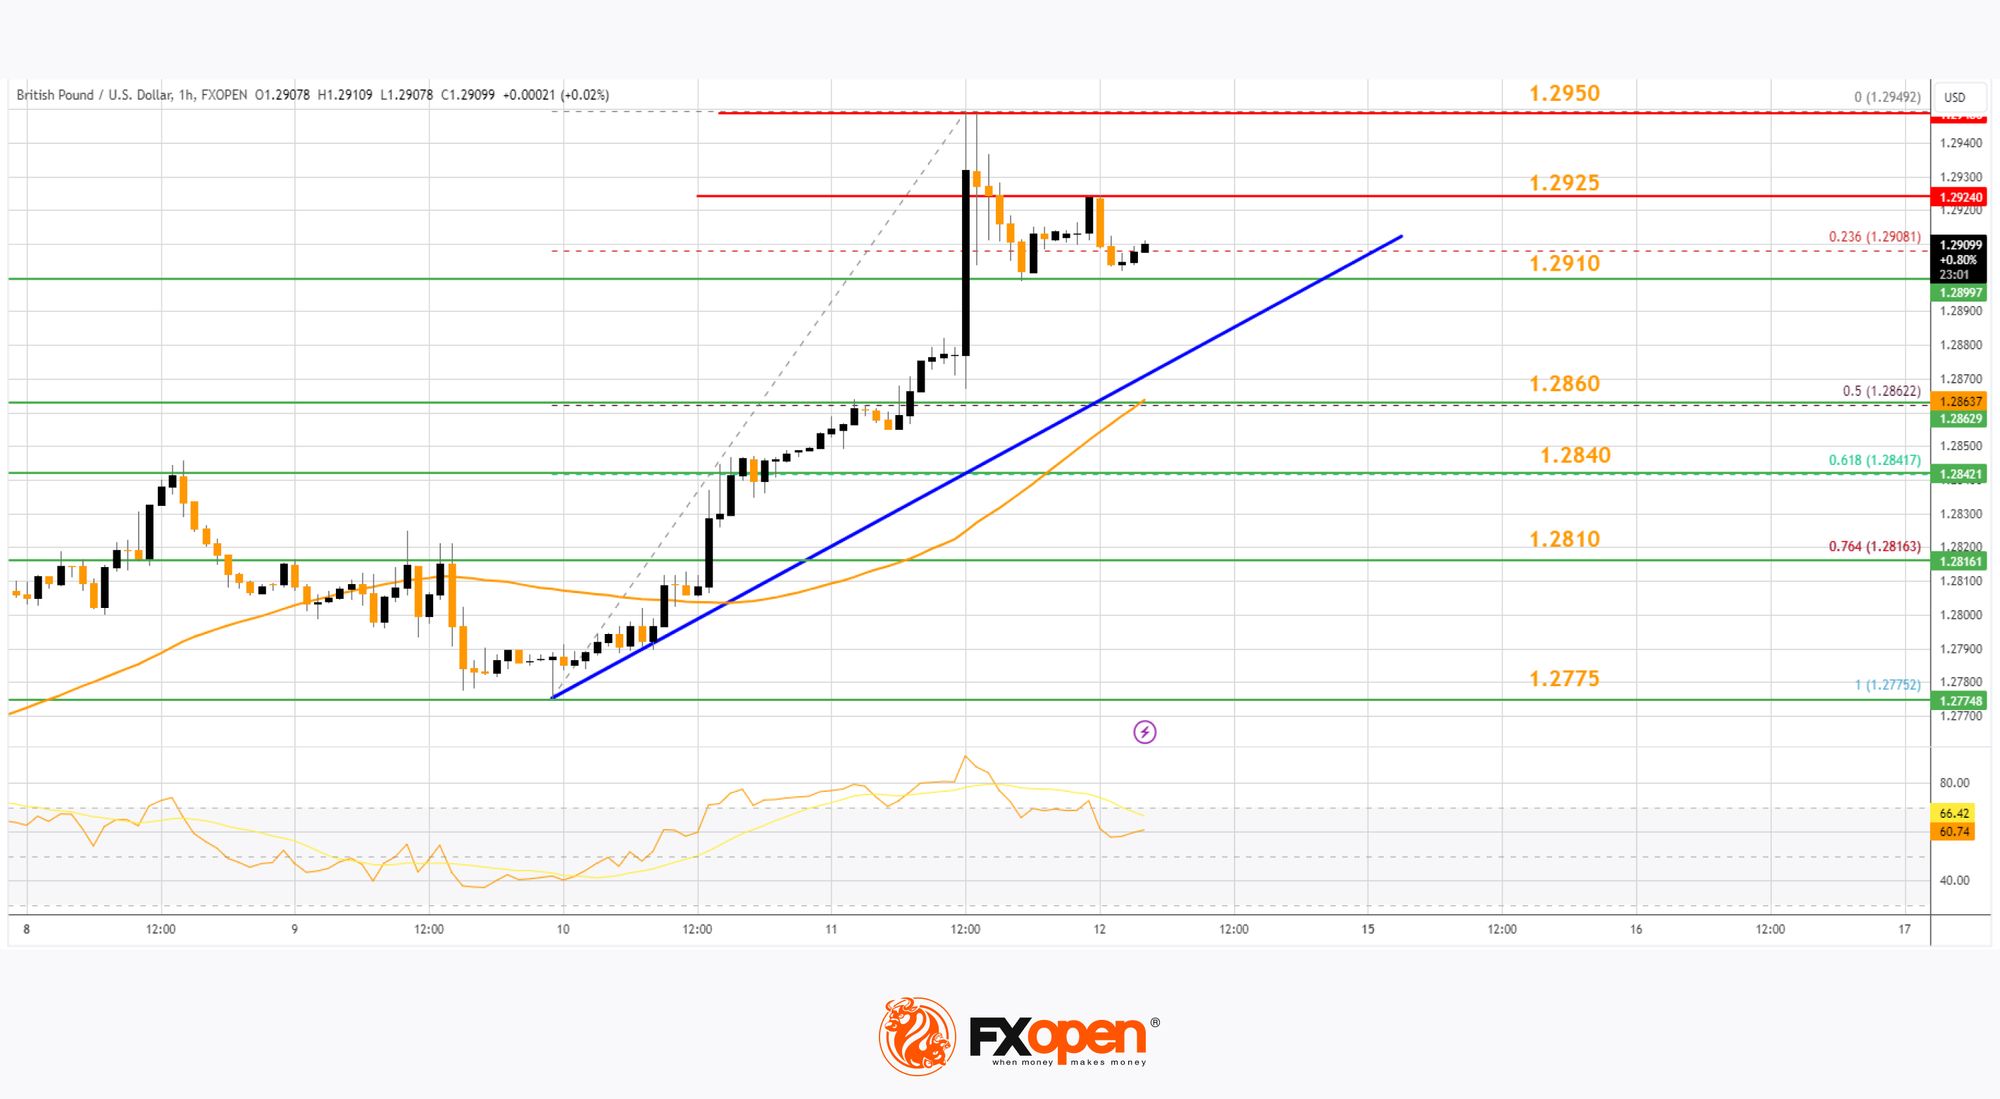
On the hourly chart of GBP/USD at FXOpen, the pair remained well-bid above the 1.2750 level. The British Pound started a decent increase above the 1.2850 zone against the US Dollar.
The bulls were able to push the pair above the 50-hour simple moving average and 1.2900. The pair even climbed above 1.2925 and traded as high as 1.2949. Recently, there was a minor decline below the 23.6% Fib retracement level of the upward move from the 1.2775 swing low to the 1.2949 high, but the bulls were active above 1.29700.
On the upside, the GBP/USD chart indicates that the pair is facing resistance near 1.2925. The next major resistance is near 1.2950.
A close above the 1.2950 resistance zone could open the doors for a move toward 1.3000. Any more gains might send GBP/USD toward 1.3200. On the downside, there is a key support forming near a bullish trend line at 1.2910.
If there is a downside break below 1.2910, the pair could accelerate lower. The next major support is at 1.2860. It is close to the 50% Fib retracement level of the upward move from the 1.2775 swing low to the 1.2949 high.
The next key support is seen near 1.2840, below which the pair could test 1.2810. Any more losses could lead the pair toward the 1.2775 support.
EUR/GBP Technical Analysis
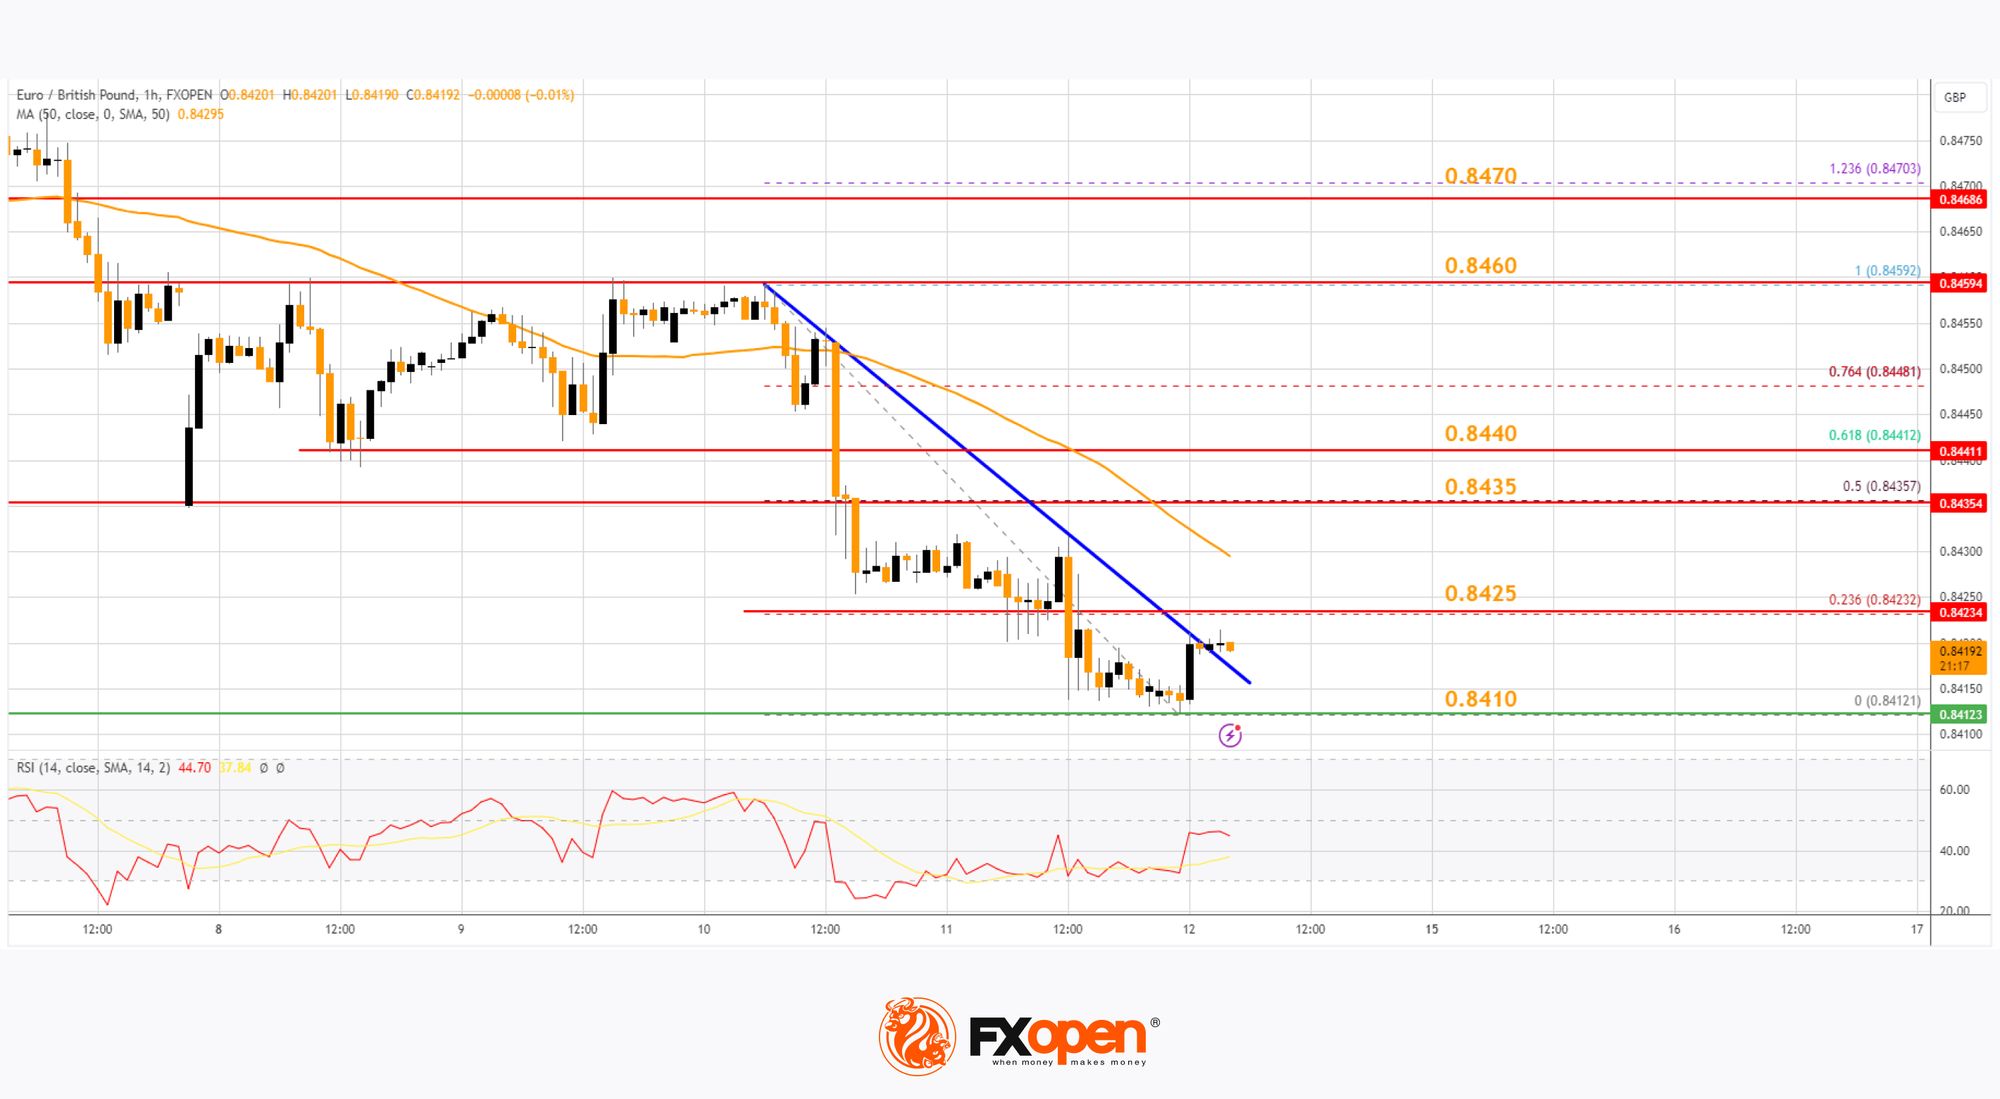
On the hourly chart of EUR/GBP at FXOpen, the pair started a steady decline from well above 0.8460. The Euro traded below the 0.8440 support level against the British Pound.
The EUR/GBP chart suggests that the pair even declined below the 0.8824 level and tested 0.8410. It is now consolidating losses and trading below the 50-hour simple moving average. Recently, there was a minor increase above a connecting bearish trend line with resistance near 0.8425.
The pair is now facing resistance near the 23.6% Fib retracement level of the downward move from the 0.8459 swing high to the 0.8412 low. The next major resistance could be 0.8435.
The 50% Fib retracement level of the downward move from the 0.8459 swing high to the 0.8412 low is also at 0.8435. A close above the 0.8435 level might accelerate gains. In the stated case, the bulls may perhaps aim for a test of 0.8460. Any more gains might send the pair toward the 0.8500 level.
Immediate support sits near 0.8410. The next major support is near 0.8400. A downside break below the 0.8400 support might call for more downsides. In the stated case, the pair could drop toward the 0.8360 support level.
Trade over 50 forex markets 24 hours a day with FXOpen. Take advantage of low commissions, deep liquidity, and spreads from 0.0 pips (additional fees may apply). Open your FXOpen account now or learn more about trading forex with FXOpen.
This article represents the opinion of the Companies operating under the FXOpen brand only. It is not to be construed as an offer, solicitation, or recommendation with respect to products and services provided by the Companies operating under the FXOpen brand, nor is it to be considered financial advice.
Stay ahead of the market!
Subscribe now to our mailing list and receive the latest market news and insights delivered directly to your inbox.


Latest articles

Market Analysis: GBP/USD Dips Further As EUR/GBP Regains Traction
GBP/USD failed to climb above 1.3500 and corrected some gains. EUR/GBP started a decent increase and might aim for more gains above 0.8700.
Important Takeaways for GBP/USD and EUR/GBP Analysis Today
· The British Pound


Market Insights with Gary Thomson: Oil, US Retail Sales & NFP in Focus
In this video, we’ll explore the key economic events and market trends, shaping the financial landscape. Get ready for insights into financial markets to help you navigate the week ahead. Let’s dive in!
In this episode of Market