


FXOpen
GBP/USD faced resistance near 1.2845 and started a downside correction. USD/CAD is struggling below 1.3210 and might decline further.
Important Takeaways for GBP/USD and USD/CAD
· The British Pound started a downside correction below the 1.2845 zone.
· There is a key bearish trend line forming with resistance near 1.2740 on the hourly chart of GBP/USD at FXOpen.
· USD/CAD declined below the 1.3210 and 1.3185 support levels.
· A connecting bearish trend line is forming with resistance near 1.3185 on the hourly chart at FXOpen.
GBP/USD Technical Analysis
On the hourly chart of GBP/USD at FXOpen, the pair was able to climb above the 1.2800 resistance zone. However, the bears were active near the 1.2845 zone.
As a result, the pair started a downside correction below the 1.2780 and 1.2740 support levels. The pair even spiked below 1.2700 before the bulls appeared near 1.2690. A low is formed near 1.2684 and the pair is now consolidating losses.
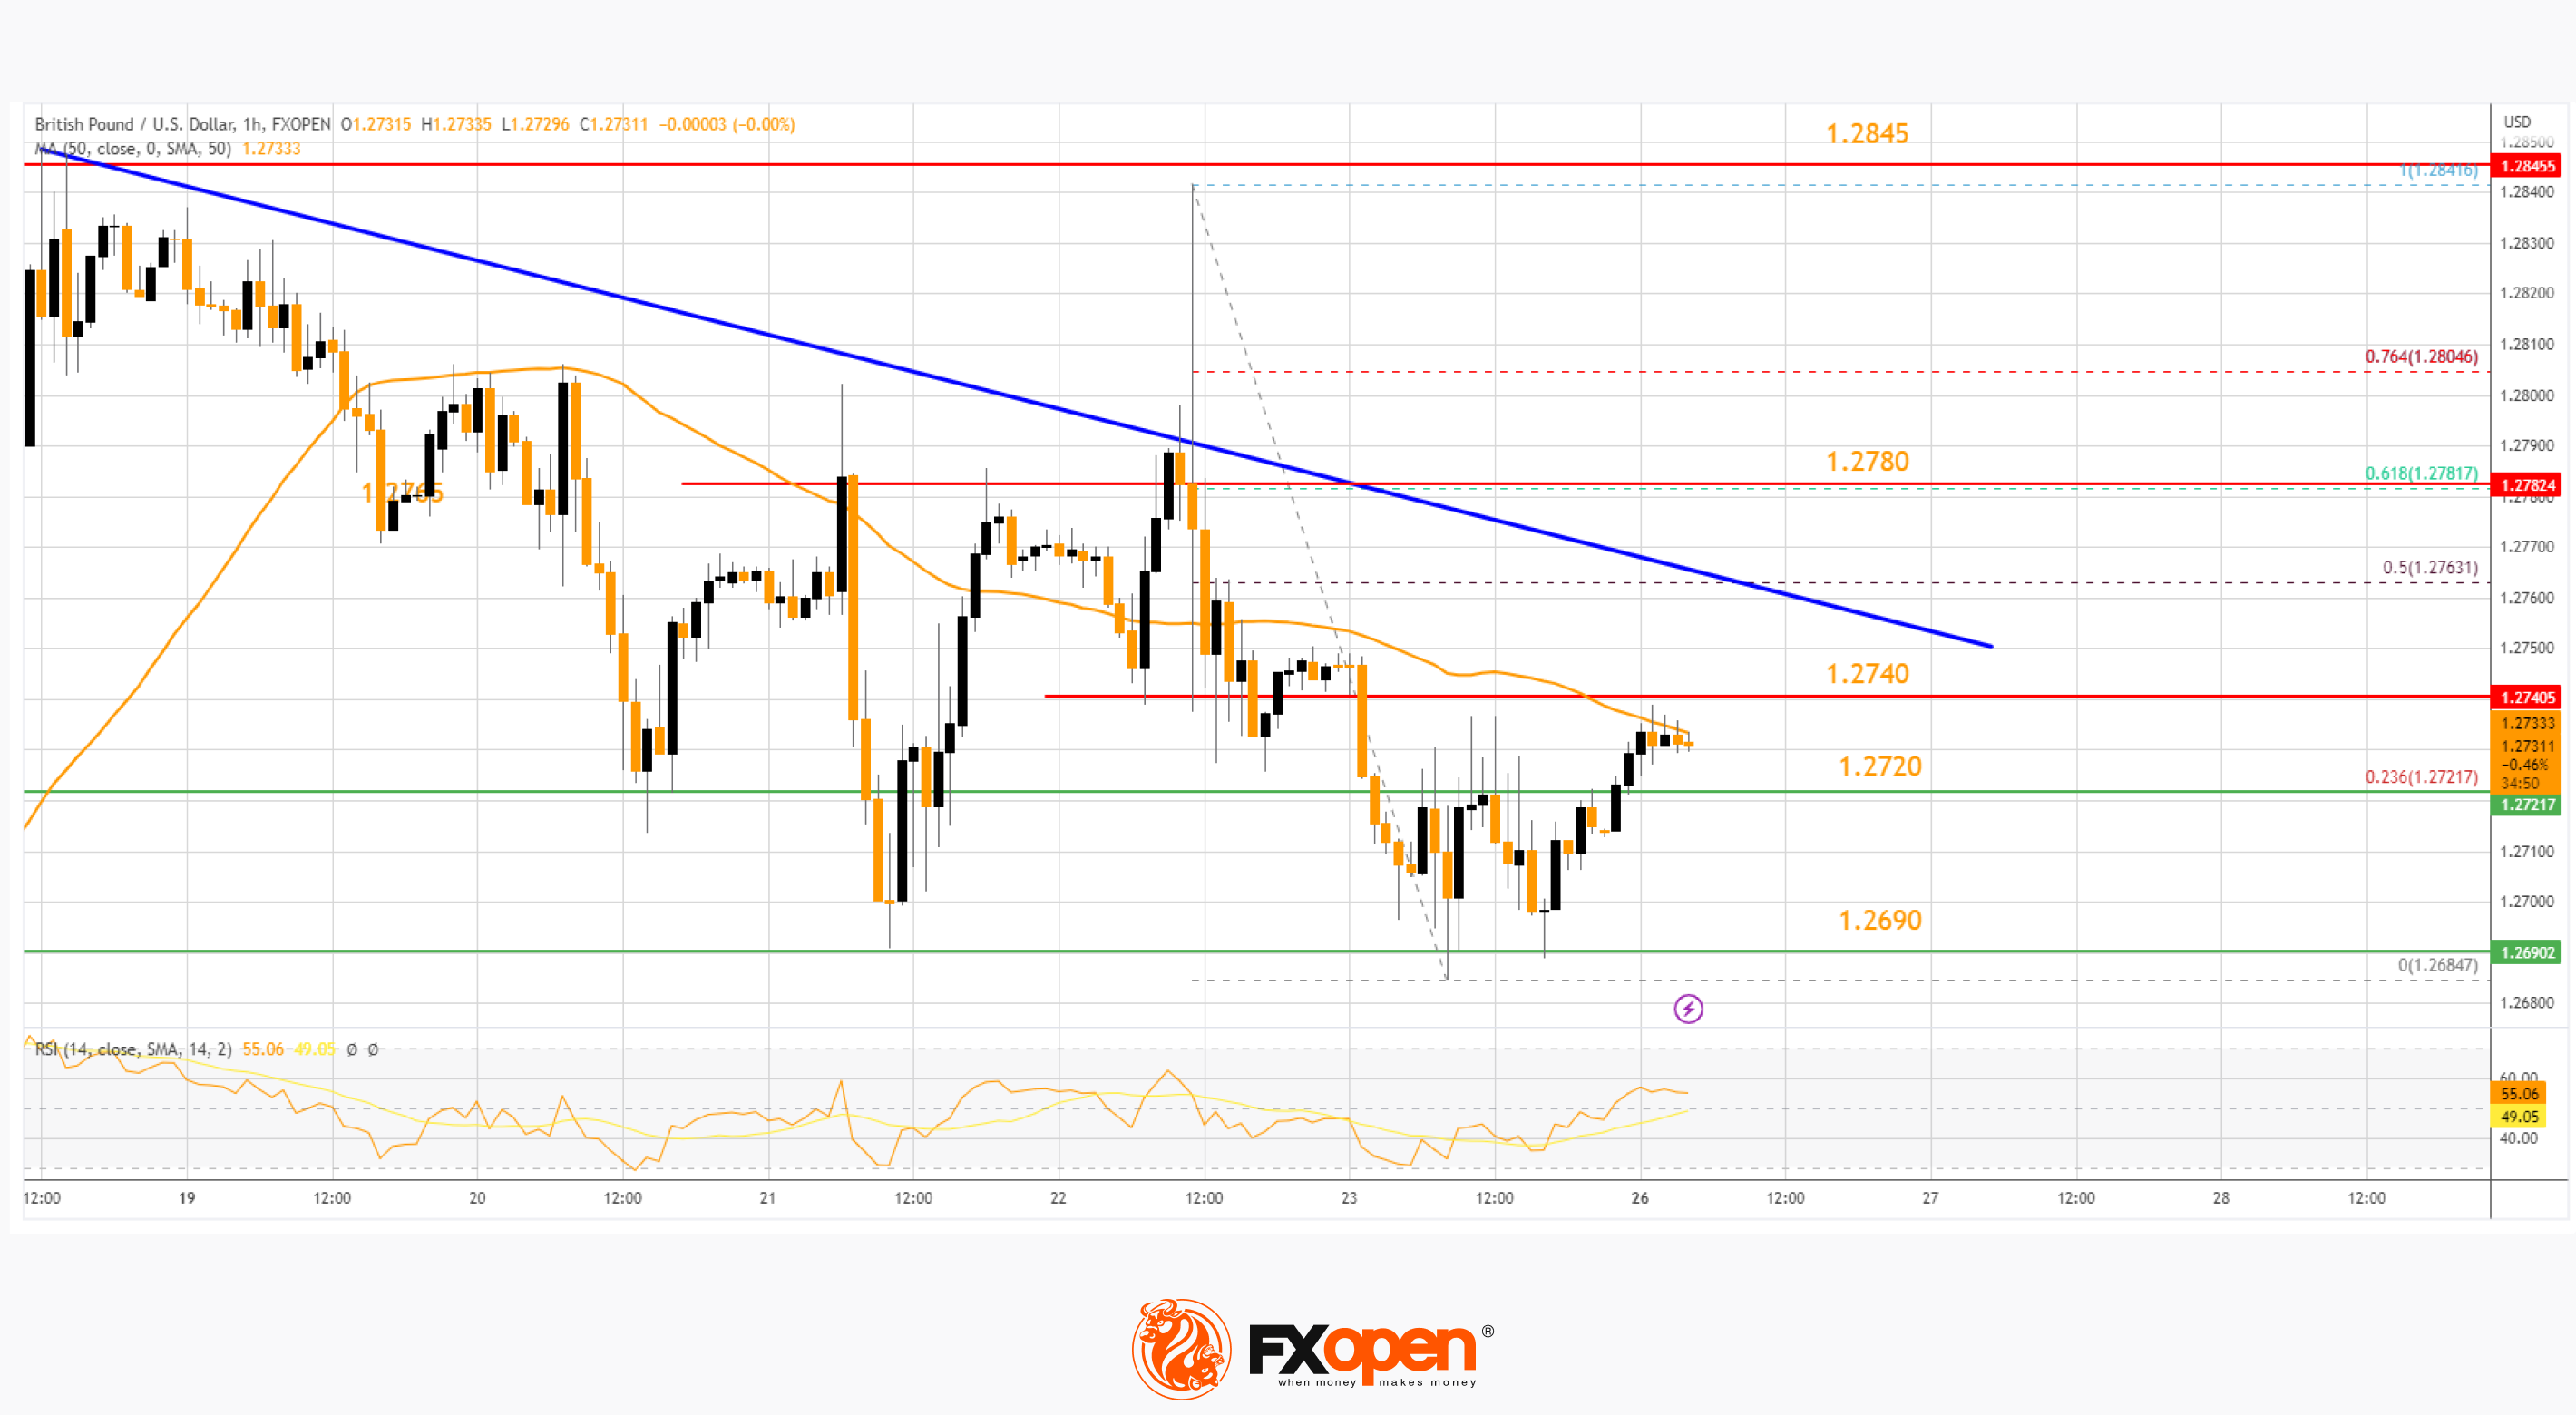
There was a move above the 23.6% Fib retracement level of the downward move from the 1.2841 swing high to the 1.2684 low. Immediate resistance on the GBP/USD chart is forming near the 50-hour simple moving average at 1.2732.
The next resistance is near a key bearish trend line at 1.2740. An upside break above the 1.2740 zone, the pair could rise toward 1.2780. It coincides with the 61.8% Fib retracement level of the downward move from the 1.2841 swing high to the 1.2684 low.
Any more gains might open the doors for a test of 1.2845. On the downside, initial support is near the 1.2720 area. The next major support is near the 1.2690 level. If there is a break below 1.2690, the pair could extend its decline. The next key support is near the 1.2640 level. Any more losses might call for a test of the 1.2580 support.
USD/CAD Technical Analysis
On the hourly chart of USD/CAD at FXOpen, the pair started a fresh decline from the 1.3240 resistance zone. The US Dollar gained bearish momentum below the 1.3210 support against the Canadian Dollar.
The bears were able to push the pair below the 50% Fib retracement level of the upward move from the 1.3138 swing low to the 1.3225 high. It is now trading below the 50-hour simple moving average.
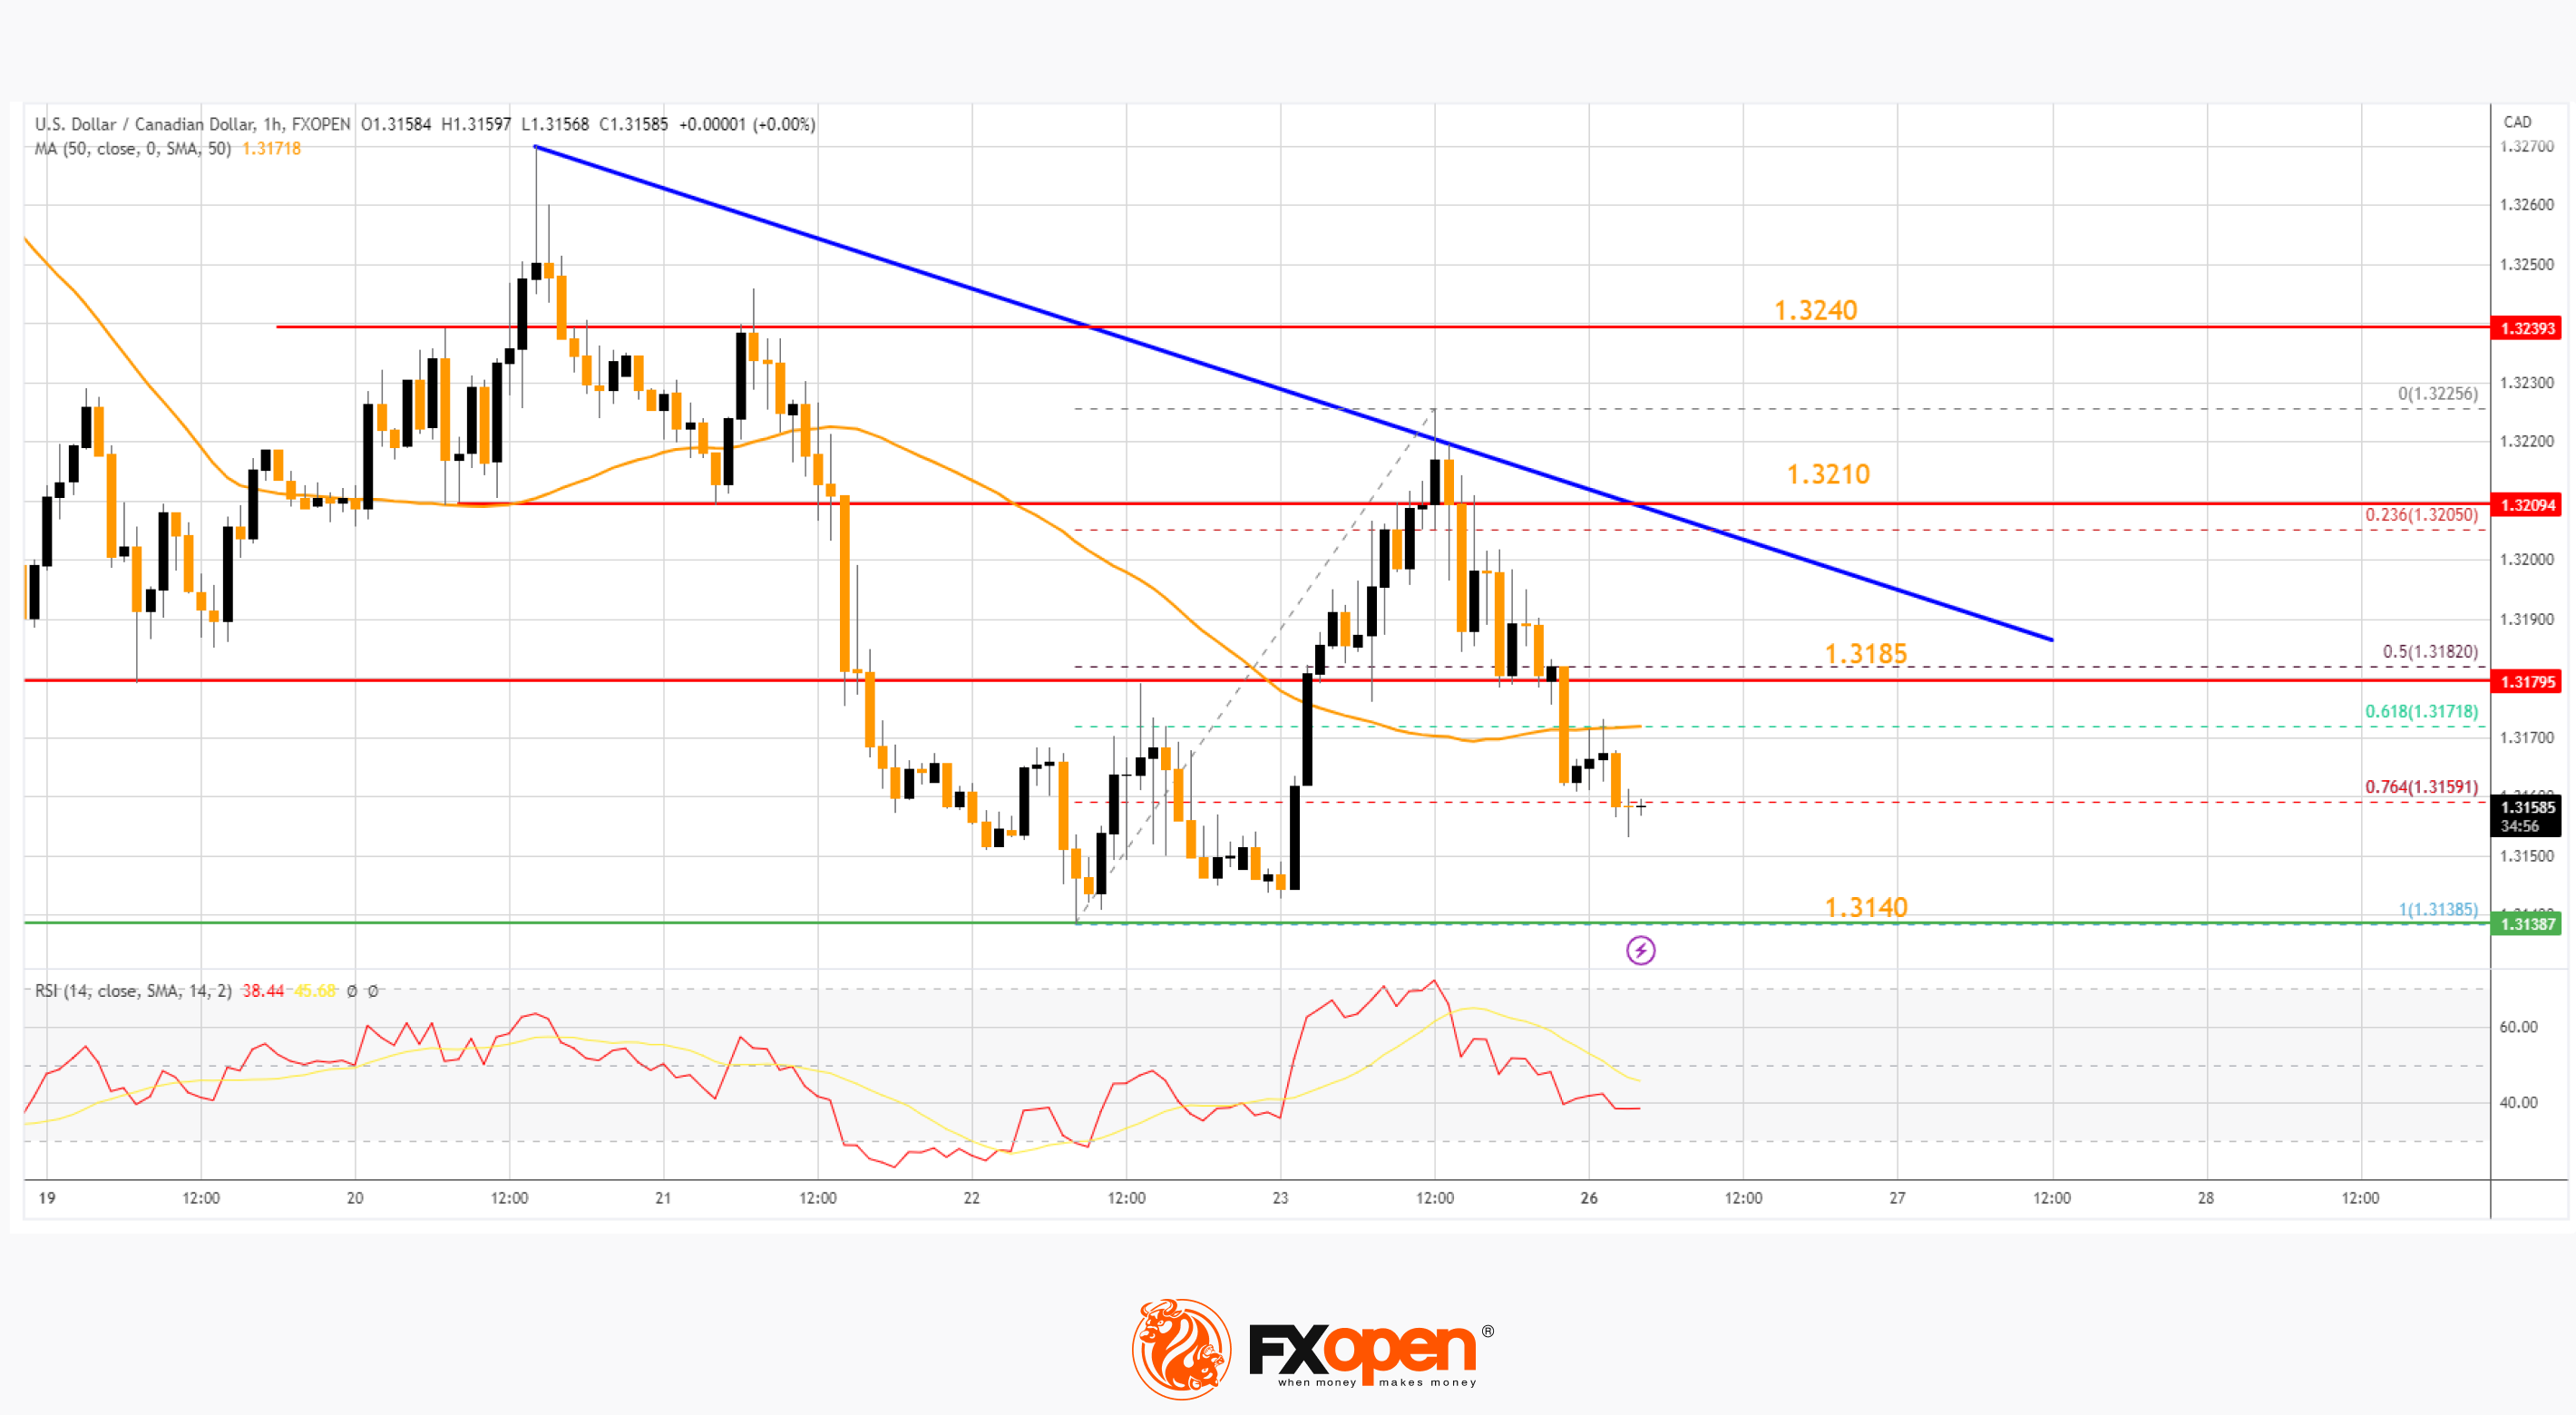
It is also showing bearish signs below the 76.4% Fib retracement level of the upward move from the 1.3138 swing low to the 1.3225 high. Immediate support is near the 1.3140 level. A close below the 1.3140 level might trigger a strong decline.
In the stated case, USD/CAD might test 1.3100. Any more losses may possibly open the doors for a drop toward the 1.3040 support.
On the upside, the pair is facing resistance near a connecting bearish trend line at 1.3185. If there is an upside break above the trend line, the pair could rise toward the 1.3210 resistance.
If the bulls pump USD/CAD above the 1.3210 resistance, there might be a decent increase toward the 1.3240 level. The next major resistance is near the 1.3280 level, above which it could rise steadily toward the 1.3335 resistance zone.
This article represents the opinion of the Companies operating under the FXOpen brand only. It is not to be construed as an offer, solicitation, or recommendation with respect to products and services provided by the Companies operating under the FXOpen brand, nor is it to be considered financial advice.
Stay ahead of the market!
Subscribe now to our mailing list and receive the latest market news and insights delivered directly to your inbox.

Latest articles

Consolidation Ahead of NFP: Commodity Currencies Search for Direction
Commodity-linked currencies have entered a consolidation phase following recent directional moves, as market participants adopt a wait-and-see approach ahead of key US labour market data. Current price action reflects a balance between ongoing demand for the US dollar and attempts

The Real Driver Behind the Dollar Rally: Market Insights with Gary Thomson
The US dollar has been firm, but the drivers behind the move may be more complex than they first appear.
While geopolitical tension and shifts in risk sentiment play a role, current price behaviour seems increasingly influenced by inflation expectations

EUR/USD and USD/CHF Pull Back: Market Reacts to Fundamentals
European currencies have shown a recovery in recent trading sessions after their recent decline, displaying early signs of a reversal. The US dollar is weakening amid expectations surrounding upcoming US macroeconomic data, while market participants are reassessing their short-term positions