


FXOpen
GBP/USD started a fresh increase above the 1.2625 zone. USD/CAD is declining and trading below the 1.3415 support.
Important Takeaways for GBP/USD and USD/CAD Analysis Today
· The British Pound is eyeing more gains above the 1.2755 resistance.
· There was a break above a key bearish trend line with resistance near 1.2740 on the hourly chart of GBP/USD at FXOpen.
· USD/CAD started a fresh decline after it failed to clear the 1.3465 resistance.
· There is a short-term connecting bullish trend line forming with support near 1.3368 on the hourly chart at FXOpen.
GBP/USD Technical Analysis
On the hourly chart of GBP/USD at FXOpen, the pair formed a base above the 1.2625 level. The British Pound started a decent increase above the 1.2665 resistance zone against the US Dollar, as mentioned in the previous analysis.
The pair gained strength above the 1.2690 level. The bulls even pushed the pair above the 1.2725 level and the 50-hour simple moving average. More importantly, there was a break above a key bearish trend line with resistance near 1.2740.
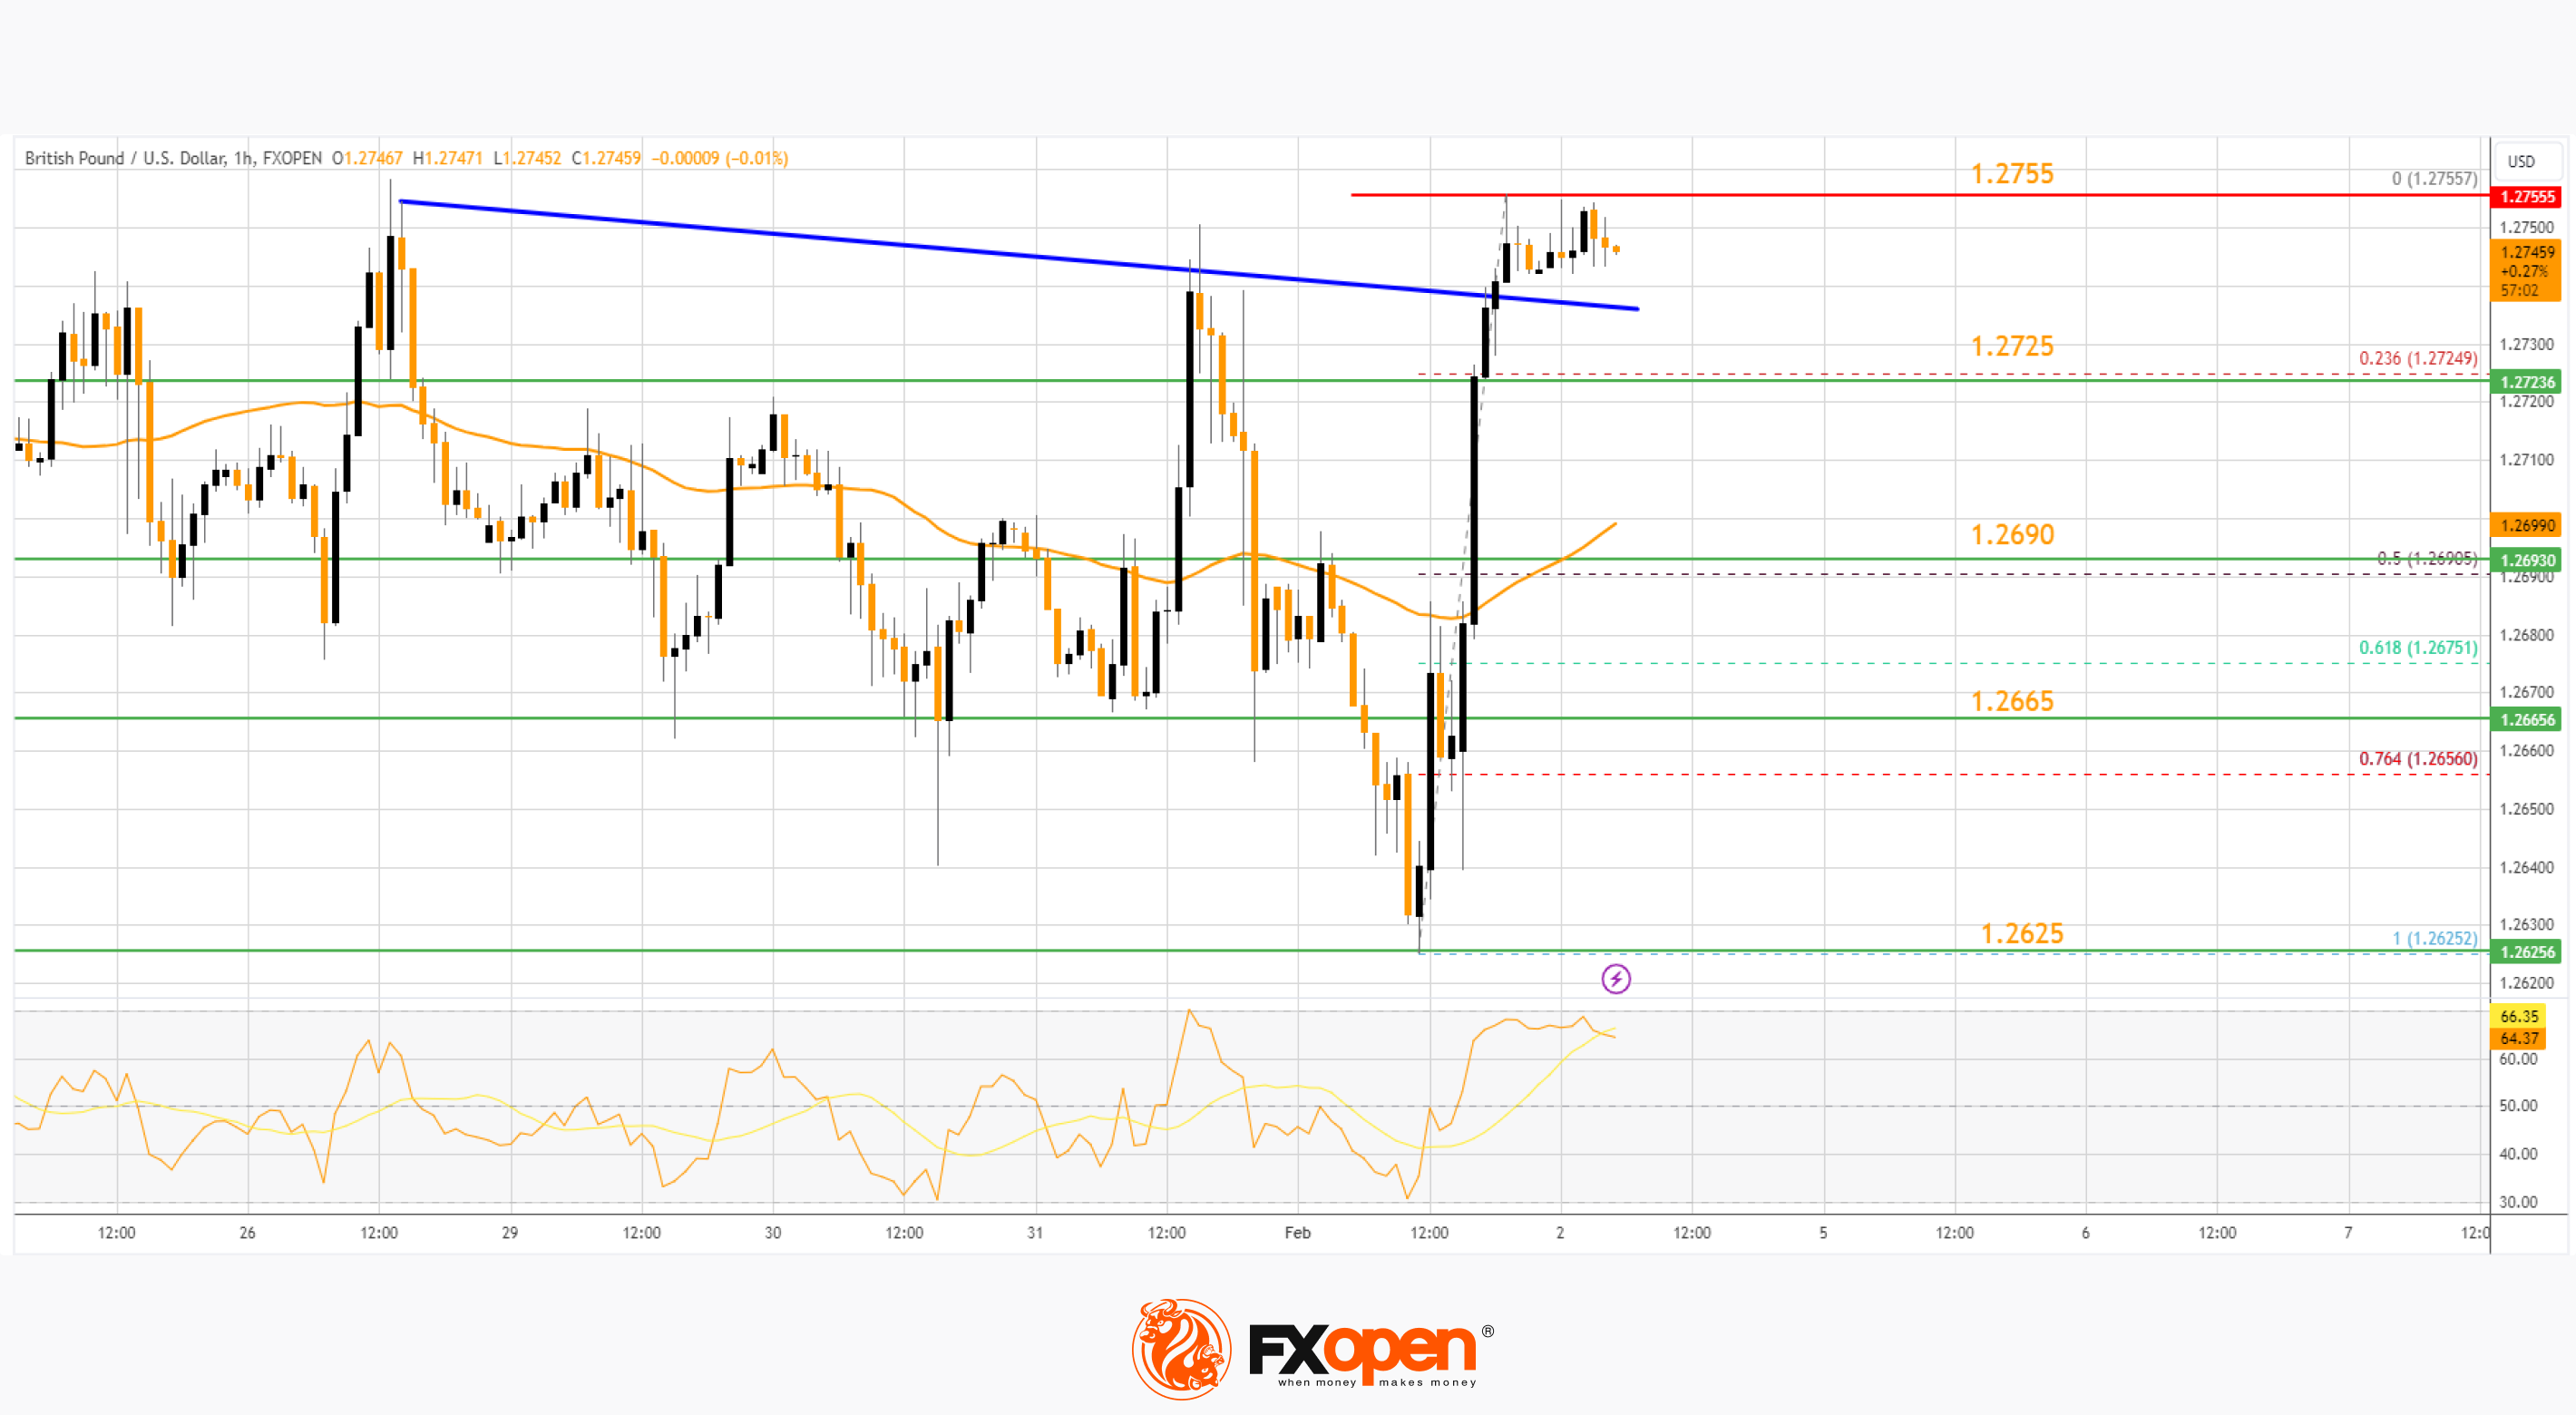
The pair tested the 1.2755 zone and is currently consolidating gains. If there is a downside correction, the pair could test the same trend line at 1.2740.
The first major support sits at the 23.6% Fib retracement level of the upward move from the 1.2625 swing low to the 1.2755 high. The next major support is 1.2690 and the 50-hour simple moving average.
The 50% Fib retracement level of the upward move from the 1.2625 swing low to the 1.2755 high is also at 1.2690. If there is a break below 1.2690, the pair could extend the decline. The next key support is near the 1.2665 level. Any more losses might call for a test of the 1.2625 support.
Conversely, the bulls might aim for more gains. The RSI moved above the 65 level on the GBP/USD chart and the pair is now approaching a major hurdle at 1.2755. An upside break above the 1.2755 zone could send the pair toward 1.2800. Any more gains might open the doors for a test of 1.2850.
USD/CAD Technical Analysis
On the hourly chart of USD/CAD at FXOpen, the pair climbed toward the 1.3440 resistance zone before the bears appeared. The US Dollar formed a high near 1.3642 and recently declined below the 1.3415 support against the Canadian Dollar.
There was also a close below the 50-hour simple moving average and 1.3390. The bulls are now active near the 1.3370 level. There is also a short-term connecting bullish trend line forming with support near 1.3368.
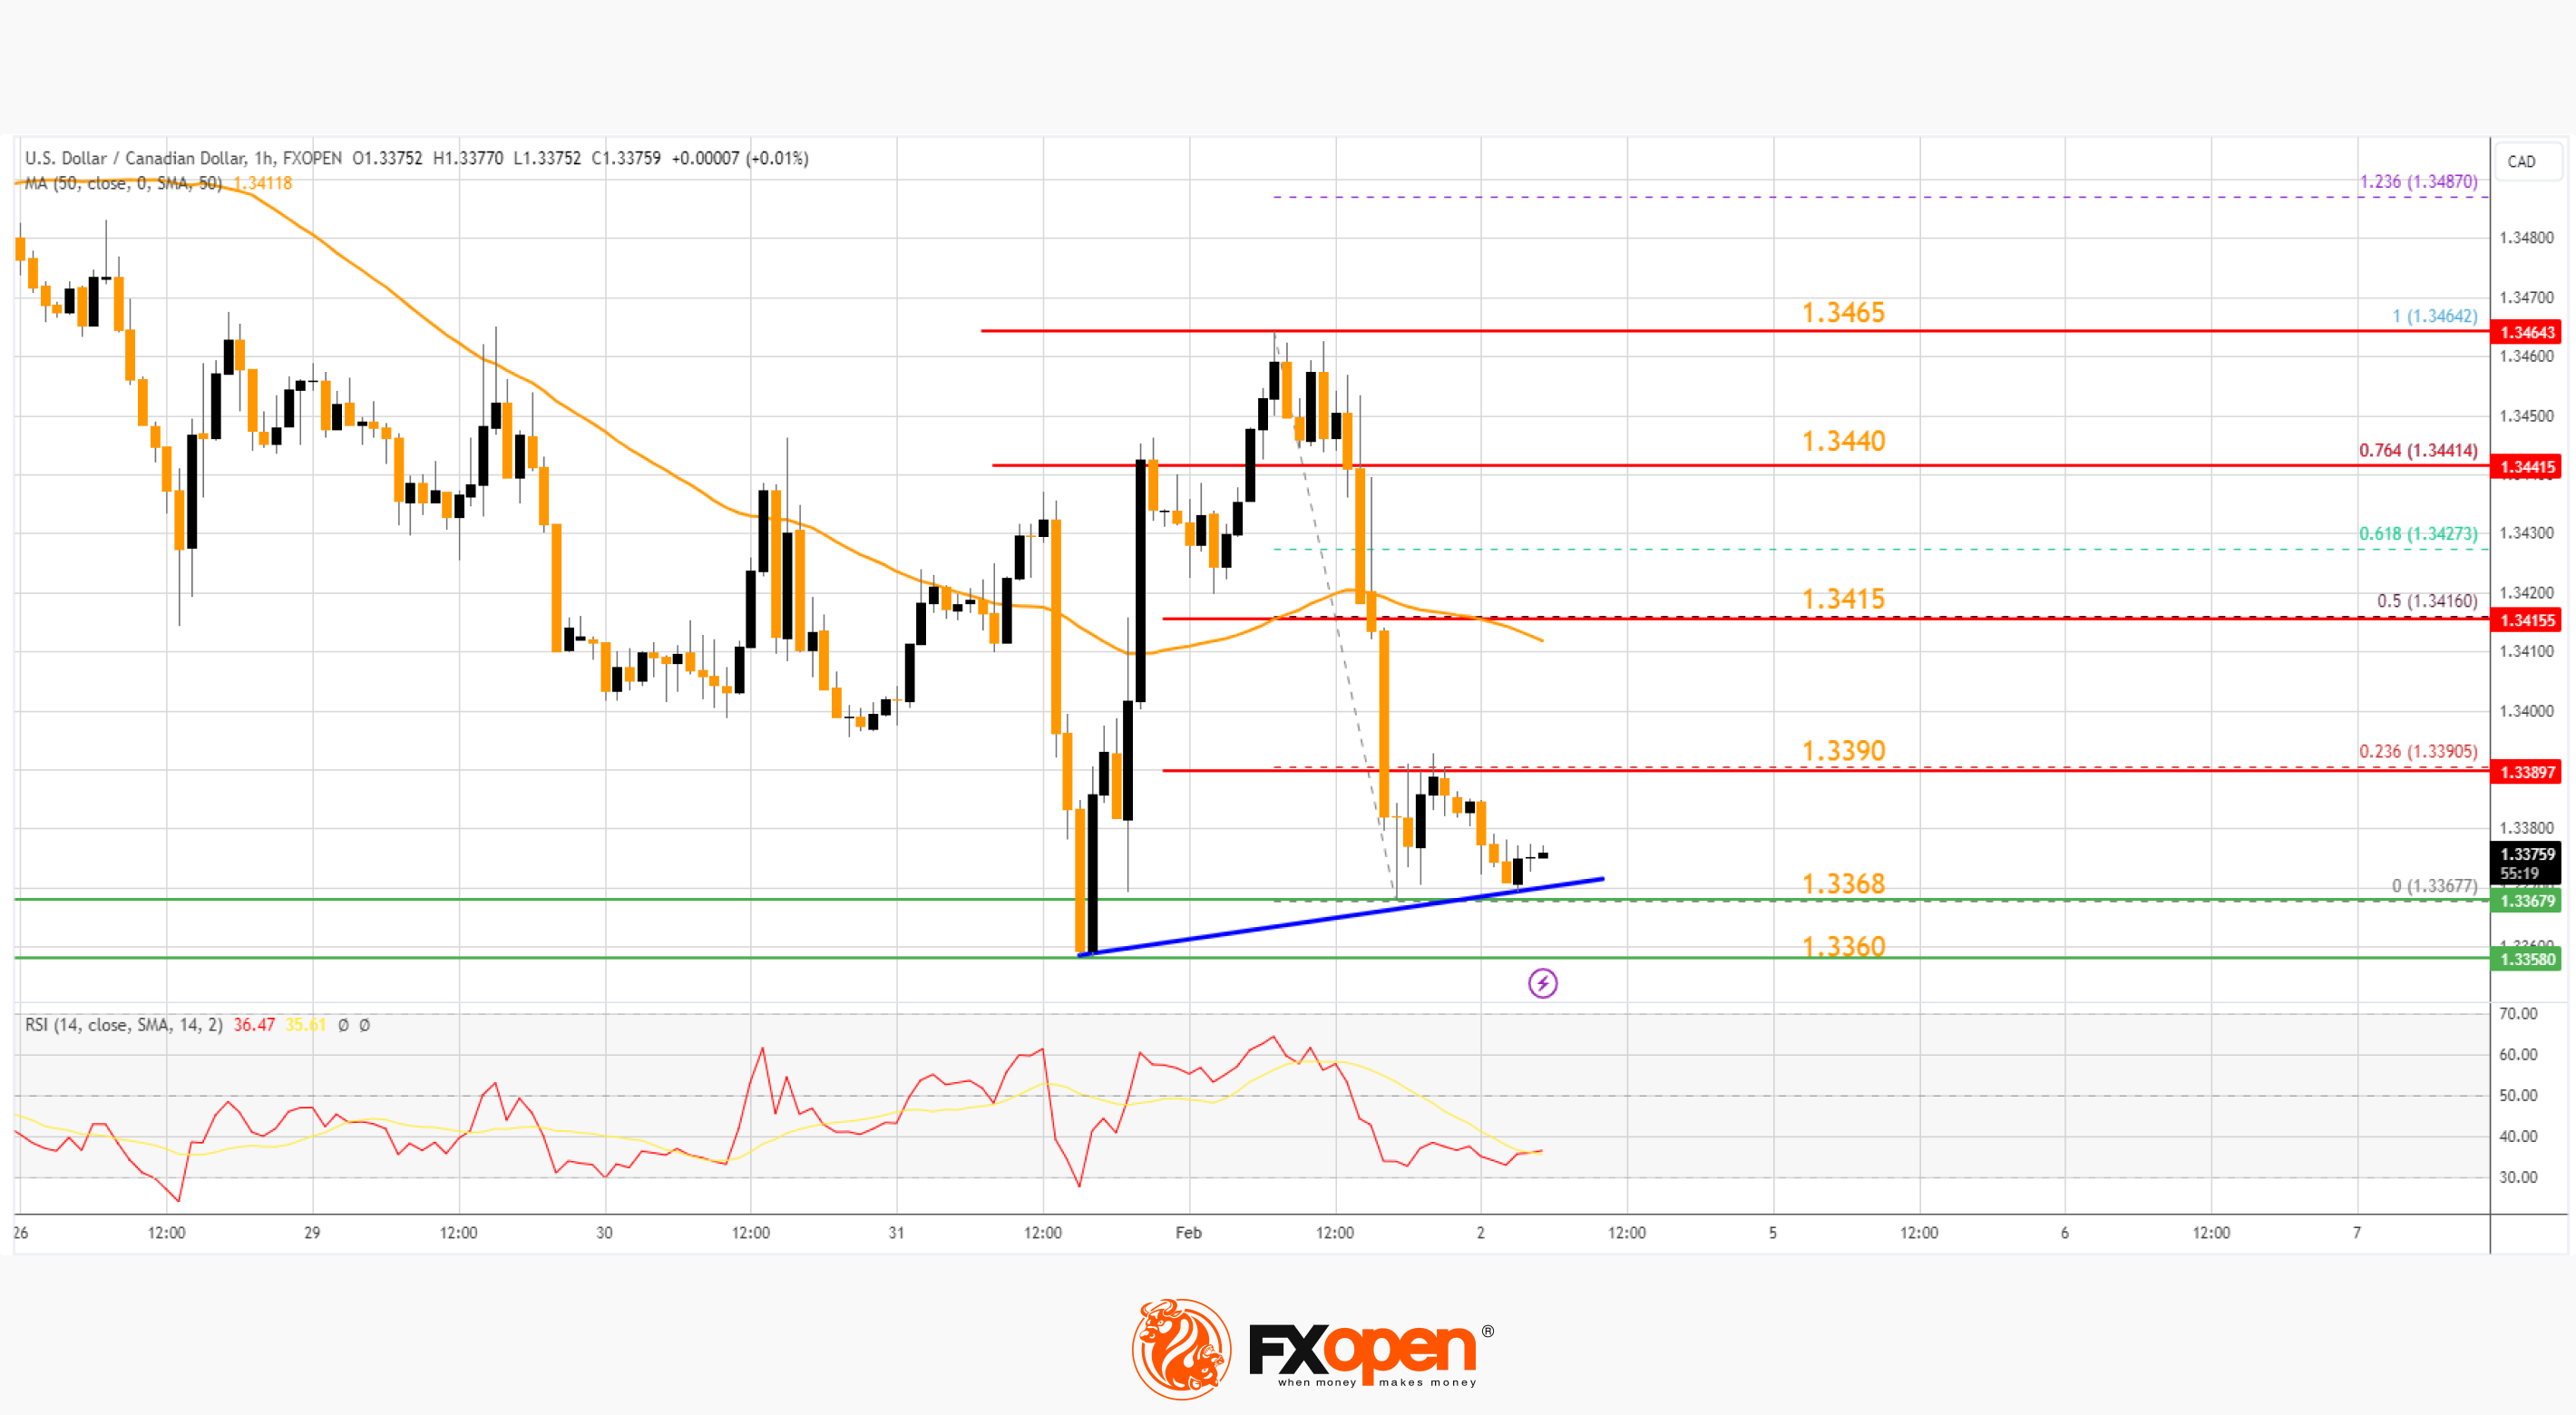
The first major support is near 1.3360. A close below the 1.3360 level might trigger a strong decline. In the stated case, USD/CAD might test 1.3300. Any more losses may possibly open the doors for a drop toward the 1.3250 support.
If there is a fresh increase, the pair could face resistance near the 23.6% Fib retracement level of the downward move from the 1.3464 swing high to the 1.3367 low.
The next key resistance on the USD/CAD chart is near the 50-hour simple moving average at 1.3415. The 50% Fib retracement level of the downward move from the 1.3464 swing high to the 1.3367 low is also at 1.3415.
If there is an upside break above 1.3415, the pair could rise toward the 1.3440 resistance. The next major resistance is near the 1.3465 level, above which it could rise steadily toward the 1.3500 resistance zone.
Trade over 50 forex markets 24 hours a day with FXOpen. Take advantage of low commissions, deep liquidity, and spreads from 0.0 pips (additional fees may apply). Open your FXOpen account now or learn more about trading forex with FXOpen.
This article represents the opinion of the Companies operating under the FXOpen brand only. It is not to be construed as an offer, solicitation, or recommendation with respect to products and services provided by the Companies operating under the FXOpen brand, nor is it to be considered financial advice.
Stay ahead of the market!
Subscribe now to our mailing list and receive the latest market news and insights delivered directly to your inbox.


Latest articles

Iran Conflict and Economic Data: Events in Focus for 2-6 March
Let’s discuss three upcoming events that may impact market activity across currencies, equities, and commodities.
✔️Washington and Israel struck Iran, the supreme leader of Iran Ayatollah Khamenei was killed. Iran retaliated, escalating tensions.
Oil jumped over 8%, global stocks

WTI Oil Trading Opens with a 10% Bullish Gap
On Friday, we warned that trading on Monday could be volatile — but not to this extent! The situation sharply escalated over the weekend following a large-scale strike by Israel and the US on targets in Iran, during which the supreme

Geopolitical Shock: Gold Price Storms $5,400 After Attack on Iran
The reason is clear: confirmed US and Israeli strikes on targets in Iran, including reports of the death of Supreme Leader Ali Khamenei, have triggered renewed demand for safe-haven assets, pushing gold prices higher.
As of Monday morning, news of