


FXOpen

GBP/USD started a fresh decline below the 1.3200 zone. USD/CAD is rising and might aim for more gains above the 1.3820 resistance.
Important Takeaways for GBP/USD and USD/CAD Analysis Today
· The British Pound started a major decline from the 1.3400 resistance zone.
· There was a break above a key bearish trend line forming with resistance at 1.3000 on the hourly chart of GBP/USD at FXOpen.
· USD/CAD is showing positive signs above the 1.3745 support zone.
· There was a break above a major bearish trend line with resistance at 1.3765 on the hourly chart at FXOpen.
GBP/USD Technical Analysis
On the hourly chart of GBP/USD at FXOpen, the pair struggled to continue higher above the 1.3400 resistance zone. The British Pound started a downside correction and traded below the 1.3200 support zone against the US Dollar.
The pair even traded below 1.3040 and the 50-hour simple moving average. Finally, the bulls appeared near the 1.2975 level. A low was formed at 1.2973 and the pair is now consolidating losses. There was a minor recovery wave above the 23.6% Fib retracement level of the downward move from the 1.3102 swing high to the 1.2973 low.
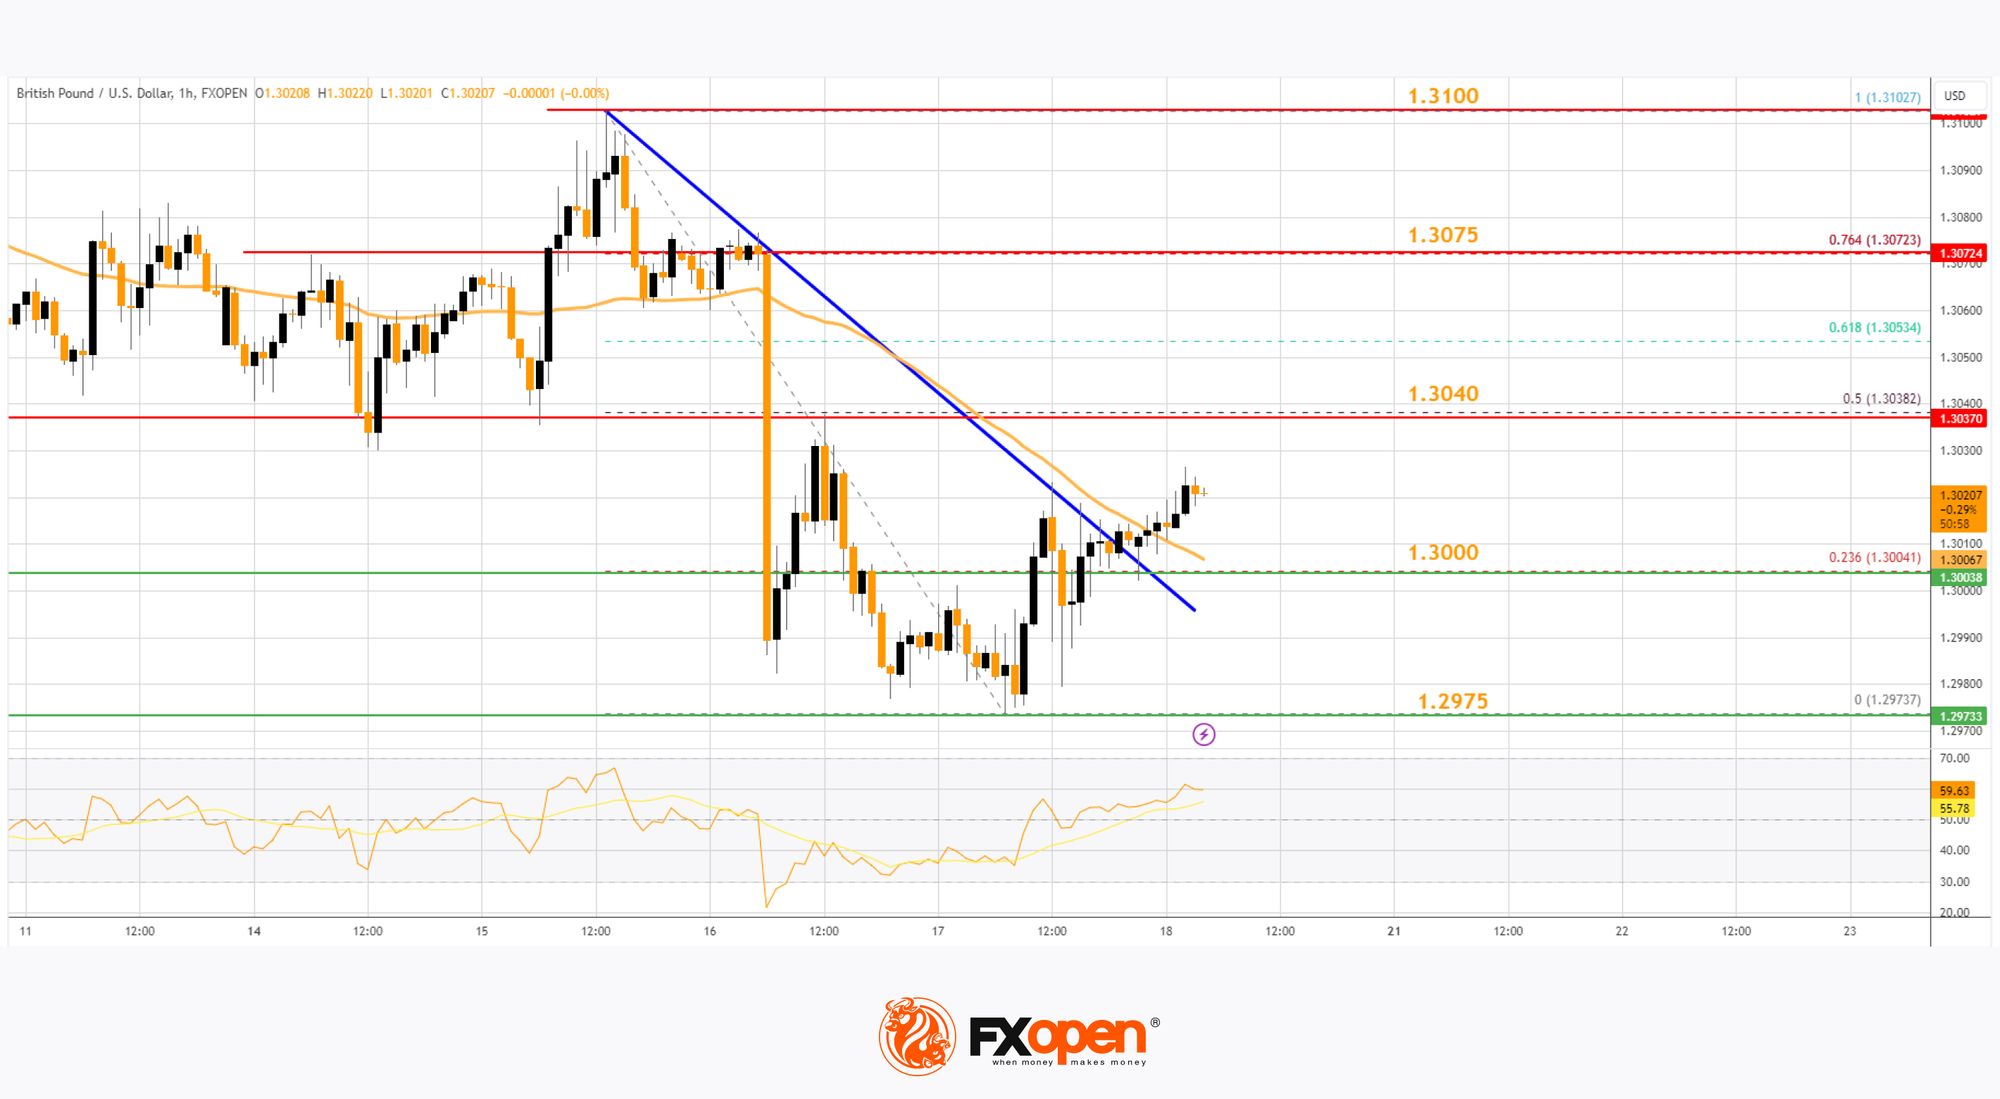
Besides, there was a break above a key bearish trend line forming with resistance at 1.3000. Immediate resistance on the upside is 1.3040 or the 50% Fib retracement level of the downward move from the 1.3102 swing high to the 1.2973 low.
The first major resistance is near the 1.3075 zone. The main hurdle sits at 1.3100. A close above the 1.3100 resistance might spark a steady upward move. The next major resistance is near the 1.3180 zone. Any more gains could lead the pair toward the 1.3220 resistance in the near term.
Initial support on the GBP/USD chart sits at 1.3000. The next major support sits at 1.2975, below which there is a risk of another sharp decline. In the stated case, the pair could drop toward 1.2900.
USD/CAD Technical Analysis
On the hourly chart of USD/CAD at FXOpen, the pair formed a strong support base above the 1.3600 level. The US Dollar started a fresh increase above the 1.3700 resistance against the Canadian Dollar.
The bulls pushed the pair above the 1.3750 and 1.3765 levels. Recently, there was a break above a major bearish trend line with resistance at 1.3765 and the 50-hour simple moving average. The pair climbed above the 50% Fib retracement level of the downward move from the 1.3838 swing high to the 1.3746 low.
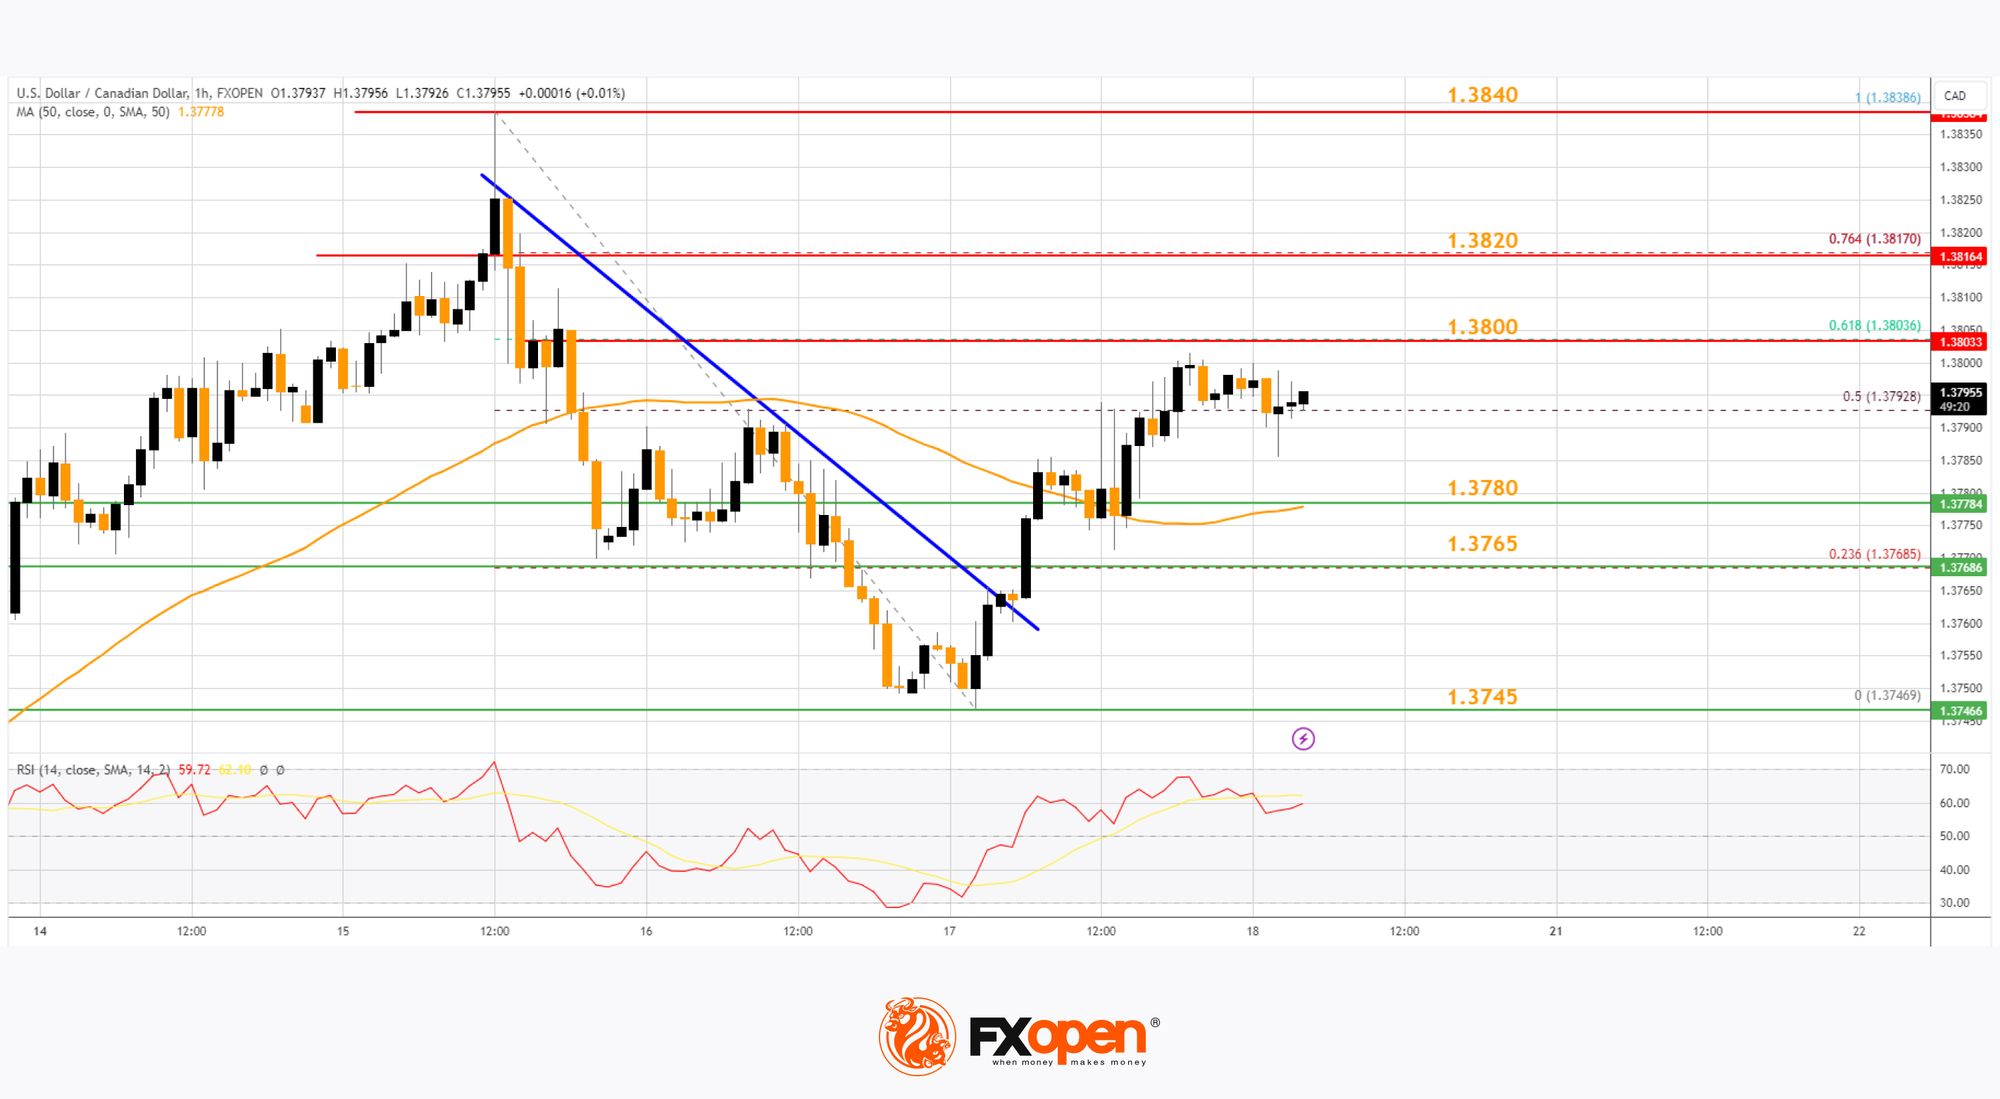
If there is another increase, the pair might face resistance near the 1.3800 level or the 61.8% Fib retracement level of the downward move from the 1.3838 swing high to the 1.3746 low.
A clear upside break above 1.3800 could start another steady increase. The next major resistance is the 1.3820 level on the same USD/CAD chart. A close above the 1.3820 level might send the pair toward the 1.3840 level. Any more gains could open the doors for a test of the 1.3910 level.
Initial support is near the 1.3780 level. The next major support is 1.3765. The main support sits near the 1.37450 zone. A downside break below the 1.3745 level could push the pair further lower. The next major support is near the 1.3700 support zone, below which the pair might visit 1.3650.
Trade over 50 forex markets 24 hours a day with FXOpen. Take advantage of low commissions, deep liquidity, and spreads from 0.0 pips (additional fees may apply). Open your FXOpen account now or learn more about trading forex with FXOpen.
This article represents the opinion of the Companies operating under the FXOpen brand only. It is not to be construed as an offer, solicitation, or recommendation with respect to products and services provided by the Companies operating under the FXOpen brand, nor is it to be considered financial advice.
Stay ahead of the market!
Subscribe now to our mailing list and receive the latest market news and insights delivered directly to your inbox.


Latest articles

Market Analysis: GBP/USD Dips Further As EUR/GBP Regains Traction
GBP/USD failed to climb above 1.3500 and corrected some gains. EUR/GBP started a decent increase and might aim for more gains above 0.8700.
Important Takeaways for GBP/USD and EUR/GBP Analysis Today
· The British Pound


Market Insights with Gary Thomson: Oil, US Retail Sales & NFP in Focus
In this video, we’ll explore the key economic events and market trends, shaping the financial landscape. Get ready for insights into financial markets to help you navigate the week ahead. Let’s dive in!
In this episode of Market