


Market Analysis: Gold Price and Crude Oil Price Gain Bullish Momentum
FXOpen
Gold price started a steady increase above the $2,200 resistance level. Crude oil prices are gaining bullish momentum and might rise toward $85.00.
Important Takeaways for Gold and Oil Prices Analysis Today
· Gold price started a decent increase from the $2,158 zone against the US Dollar.
· A connecting bullish trend line is forming with support near $2,218 on the hourly chart of gold at FXOpen.
· Crude oil prices rallied above the $81.60 and $82.00 resistance levels.
· There is a key bullish trend line forming with support at $82.30 on the hourly chart of XTI/USD at FXOpen.
Gold Price Technical Analysis
On the hourly chart of Gold at FXOpen, the price found support near the $2,158 zone. The price formed a base and started a fresh increase above the $2,175 level.
There was a decent move above the 50-hour simple moving average and $2,200. The bulls pushed the price above the $2,220 resistance zone. Finally, the bears appeared near $2,235, A high was formed near $2,236.20 and the price is now consolidating gains.
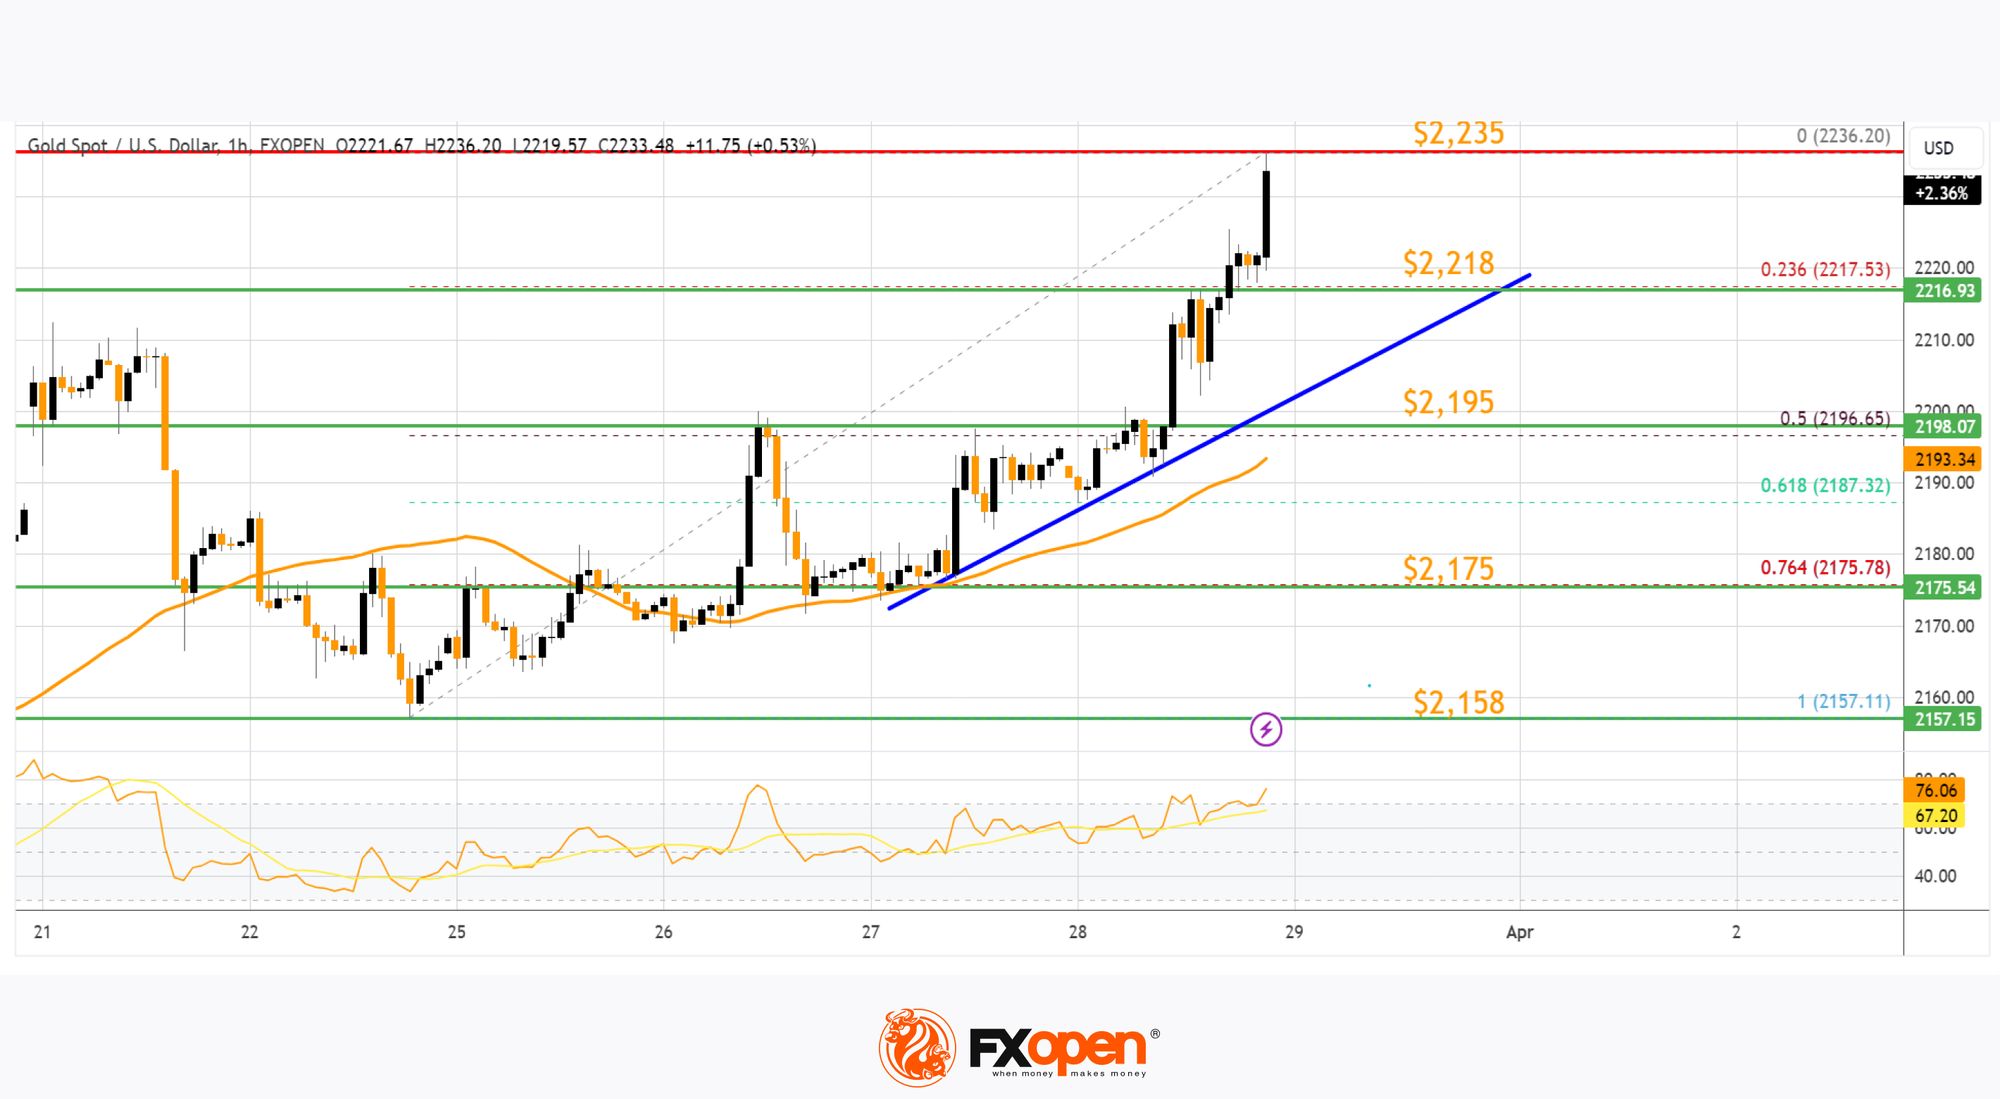
The current price action is positive above the 23.6% Fib retracement level of the upward move from the $2,157 swing low to the $2,236 high. The RSI is still stable near 60 and the price could aim for more gains.
Immediate resistance is near the $2,235 level. The next major resistance is near the $2,240 level. An upside break above the $2,240 resistance could send Gold price toward $2,250. Any more gains may perhaps set the pace for an increase toward the $2,265 level.
Initial support on the downside is near the $2,218 zone. There is also a connecting bullish trend line forming with support near $2,218. If there is a downside break below the $2,218 support, the price might decline further.
In the stated case, the price might drop toward the $2,195 support or the 50% Fib retracement level of the upward move from the $2,157 swing low to the $2,236 high.
Oil Price Technical Analysis
On the hourly chart of WTI Crude Oil at FXOpen, the price started a major rally against the US Dollar. The price gained bullish momentum after it broke the $80.00 resistance.
There was a sustained upward move above the $81.60 and $82.00 resistance levels. The bulls pushed the price toward $82.80. The current price action is positive above the 50-hour simple moving average and RSI is stable above 60.
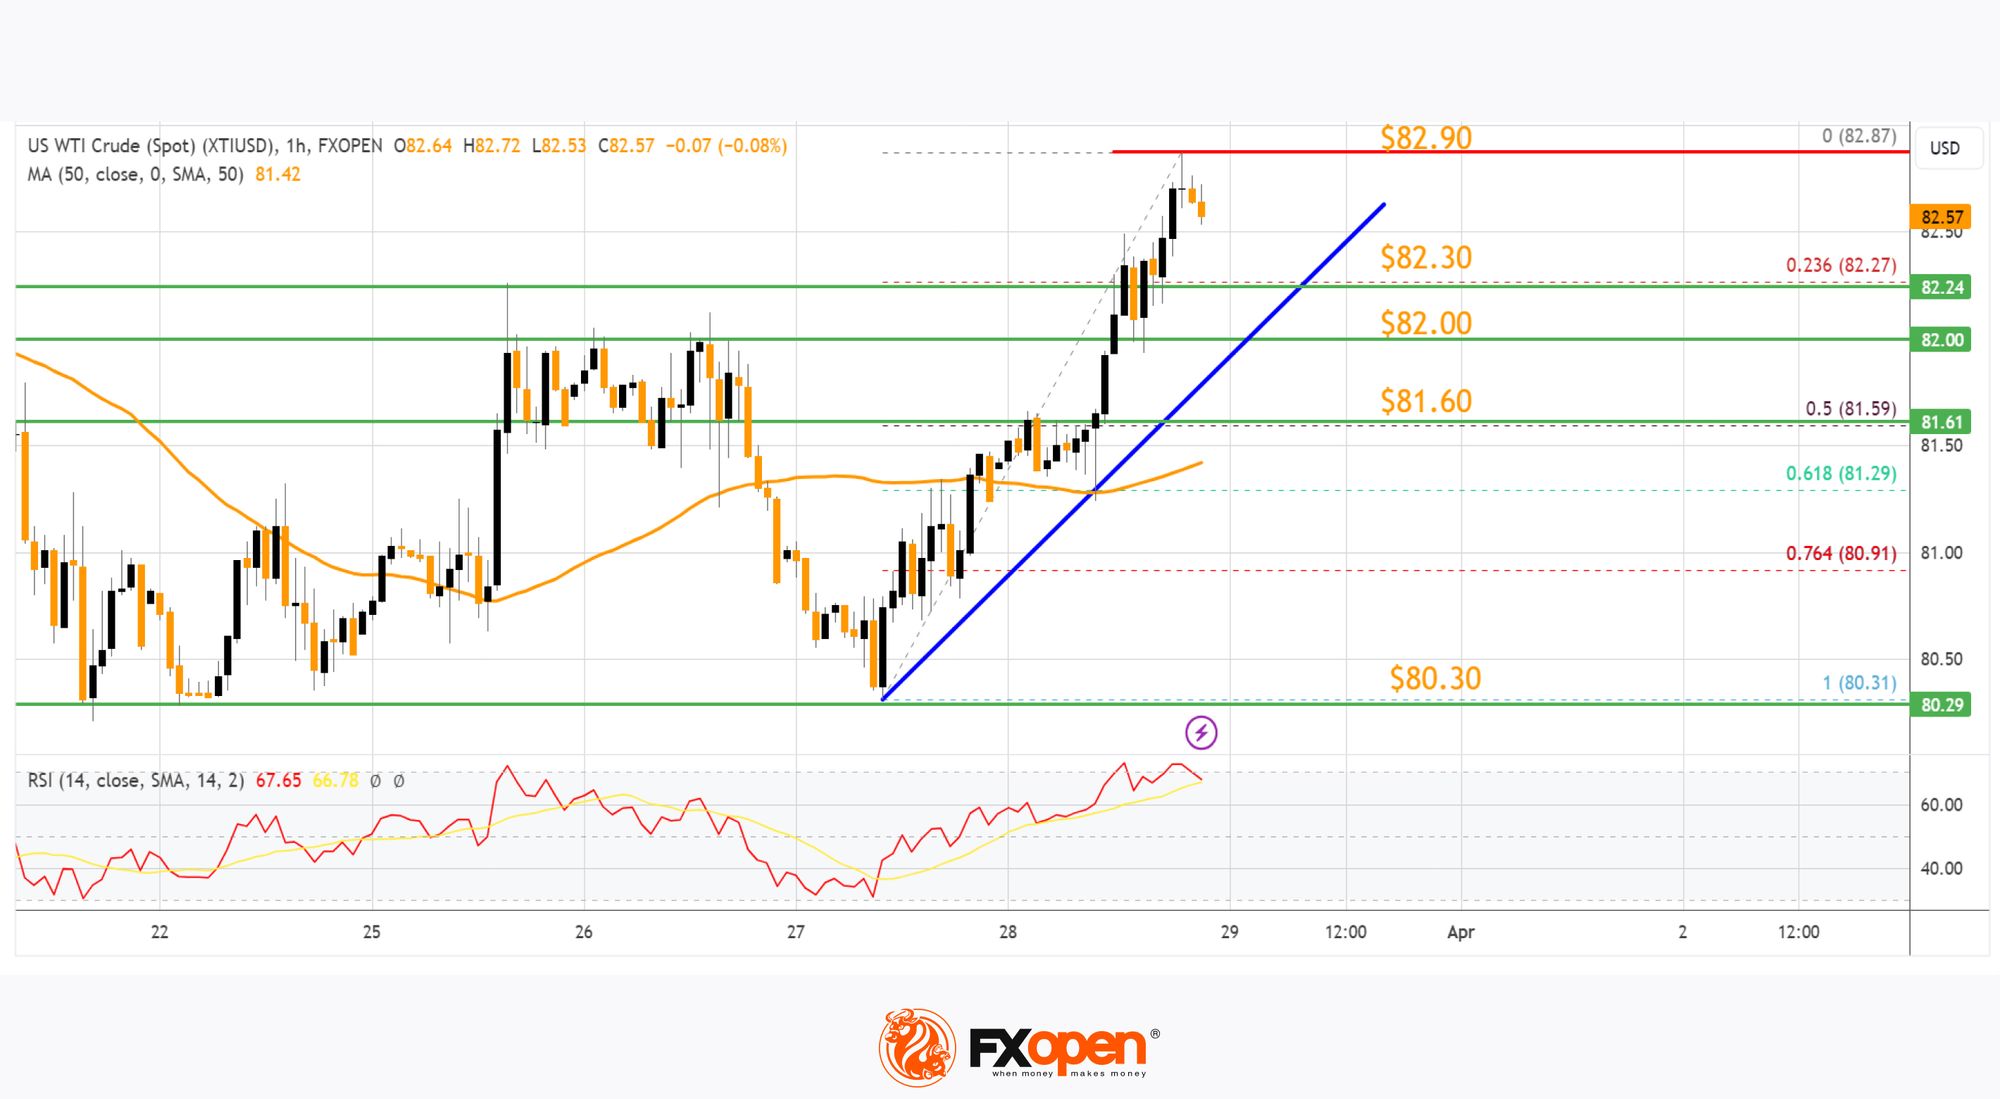
The price is holding gains above the 23.6% Fib retracement level of the upward move from the $80.30 swing low to the $82.87 high.
If the price climbs higher again, it could face resistance near $82.90. The next major resistance is near the $83.50 level. Any more gains might send the price toward the $85.00 level.
Conversely, the price might correct gains and test $82.30. There is also a key bullish trend line forming with support at $82.30. The next major support on the WTI crude oil chart is near the $81.60 zone and the 50% Fib retracement level of the upward move from the $80.30 swing low to the $82.87 high.
If there is a downside break, the price might decline toward $80.30. Any more losses may perhaps open the doors for a move toward the $78.80 support zone.
Start trading commodity CFDs with tight spreads (additional fees may apply). Open your trading account now or learn more about trading commodity CFDs with FXOpen.
This article represents the opinion of the Companies operating under the FXOpen brand only. It is not to be construed as an offer, solicitation, or recommendation with respect to products and services provided by the Companies operating under the FXOpen brand, nor is it to be considered financial advice.
Stay ahead of the market!
Subscribe now to our mailing list and receive the latest market news and insights delivered directly to your inbox.


Latest articles

S&P 500: Index Narrows Its Range as the Labour Market Cools
The broad US market index, the S&P 500, has entered July against a backdrop of mixed signals from the labour market. The Bureau of Labor Statistics report released on 2 July showed that just 57,000 jobs were

Ethereum: Has the Recovery Begun?
Ethereum has staged a notable rebound after once again testing the heavily watched psychological zone around 1500$. Since bouncing off this support, ETH/USD has climbed roughly 13%, now trading around the $1,700 mark.
This recovery is being driven

Oil Prices Are Back at Pre-Conflict Levels. Analysts Are Divided
At the start of May, oil markets were still pricing in elevated geopolitical risk and expectations of sustained supply disruption.
But easing tensions between Washington and Tehran, along with improving supply expectations, have rapidly shifted sentiment back toward fundamentals.
📉 Brent