


FXOpen

Gold price is correcting gains below the $1,980 support. Crude oil prices declined heavily below the $80.00 support and moved into a bearish zone.
Important Takeaways for Gold and Oil Prices Analysis Today
· Gold price failed to settle above the $2,000 region and moved lower against the US Dollar.
· It broke a major bearish trend line with resistance near $1,958 on the hourly chart of gold at FXOpen.
· Crude oil prices dived toward the $75 zone before the bulls appeared.
· A key bearish trend line is forming with resistance near $76.90 on the hourly chart of XTI/USD at FXOpen.
Gold Price Technical Analysis
On the hourly chart of Gold at FXOpen, the price struggled to settle above the $2,000 resistance. The price started a fresh decline below the $1,980 pivot level.
The price traded below the $1,965 support and the 50-hour simple moving average. It tested the $1,945 zone. A low is formed near $1,944.71 and the price is now attempting a fresh increase. It broke a major bearish trend line with resistance near $1,958.
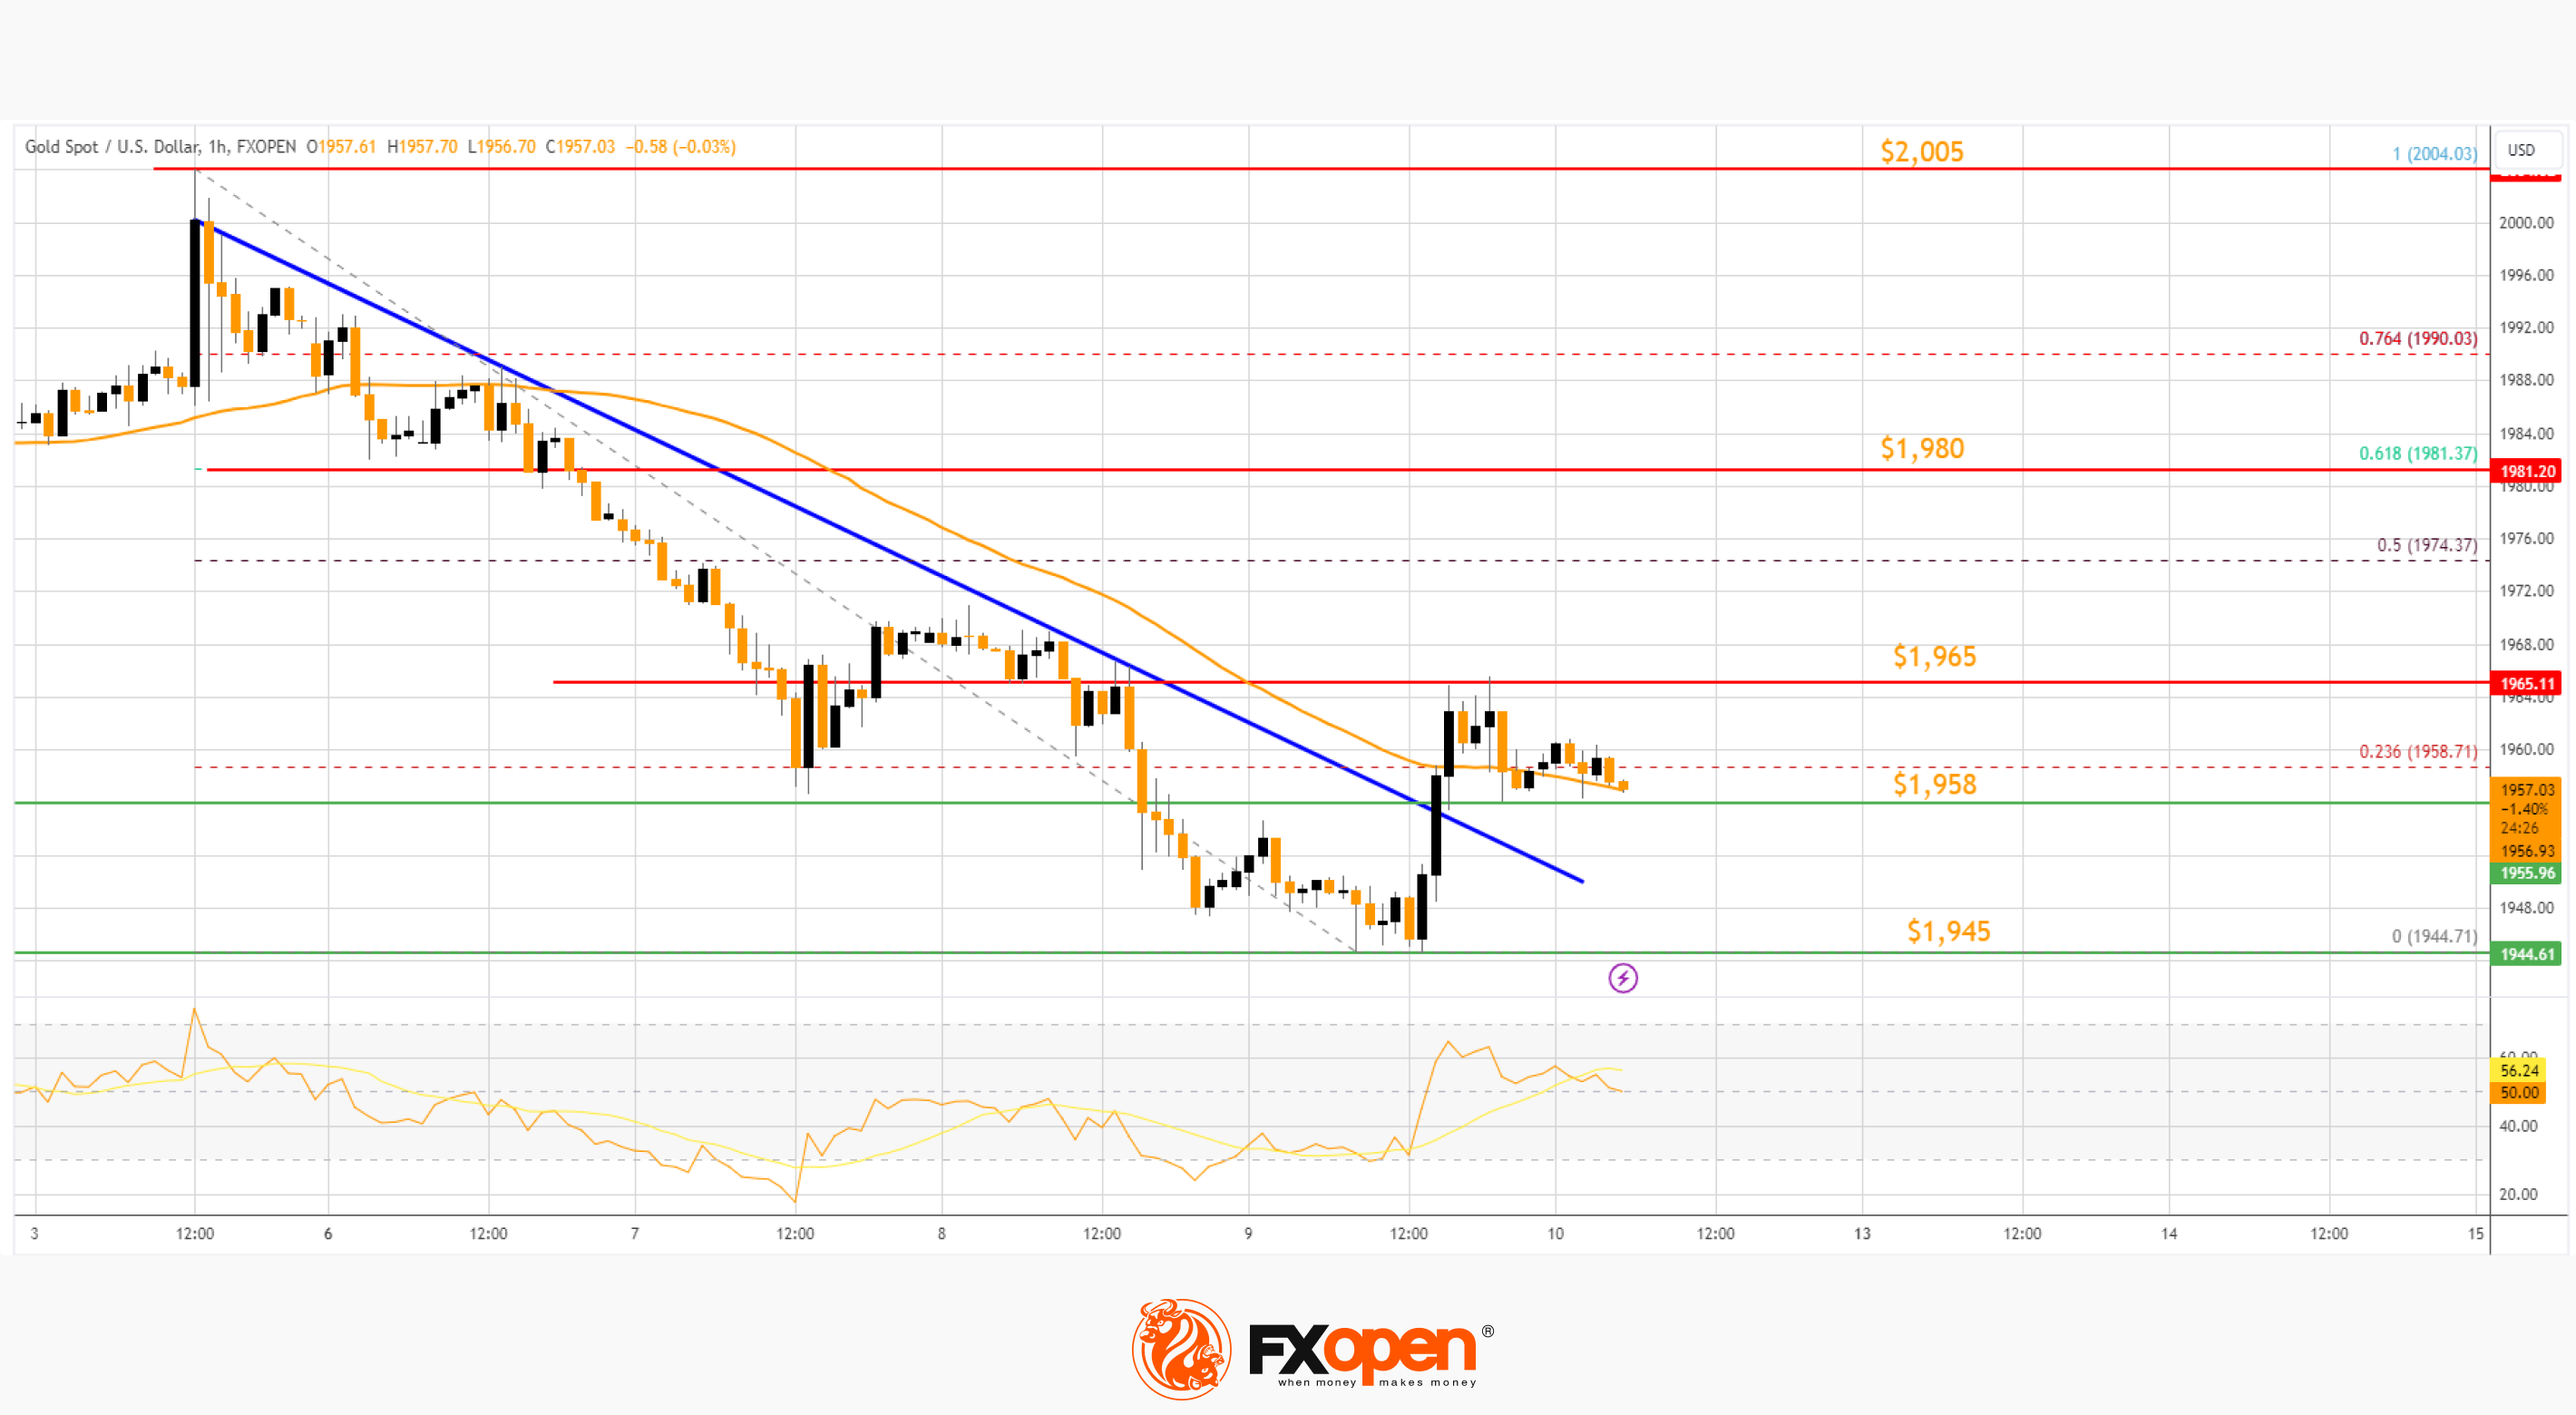
There was also a spike above the 23.6% Fib retracement level of the downward move from the $2,005 swing high to the $1,945 low. It is now facing resistance near the $1,965 level.
The next major resistance is near the 61.8% Fib retracement level of the downward move from the $2,005 swing high to the $1,945 low at $1,980, above which the price could test the $2,005 resistance.
The next major resistance is $2,020. An upside break above the $2,020 resistance could send Gold price toward $2,032. Any more gains may perhaps set the pace for an increase toward the $2,050 level.
Initial support on the downside is near the $1,958 level. The first major support is near the $1,945 level. If there is a downside break below the $1,945 support, the price might decline further. In the stated case, the price might drop toward the $1,920 support.
Oil Price Technical Analysis
On the hourly chart of WTI Crude Oil at FXOpen, the price struggled to continue higher above $83.30 against the US Dollar. The price formed a short-term top and started a fresh decline below $80.00.
There was a steady decline below the $78.00 pivot level. The bears even pushed the price below $77.00 and the 50-hour simple moving average. Finally, the price tested the $75.00 zone. A low is formed near $74.90 and the price is now consolidating losses.
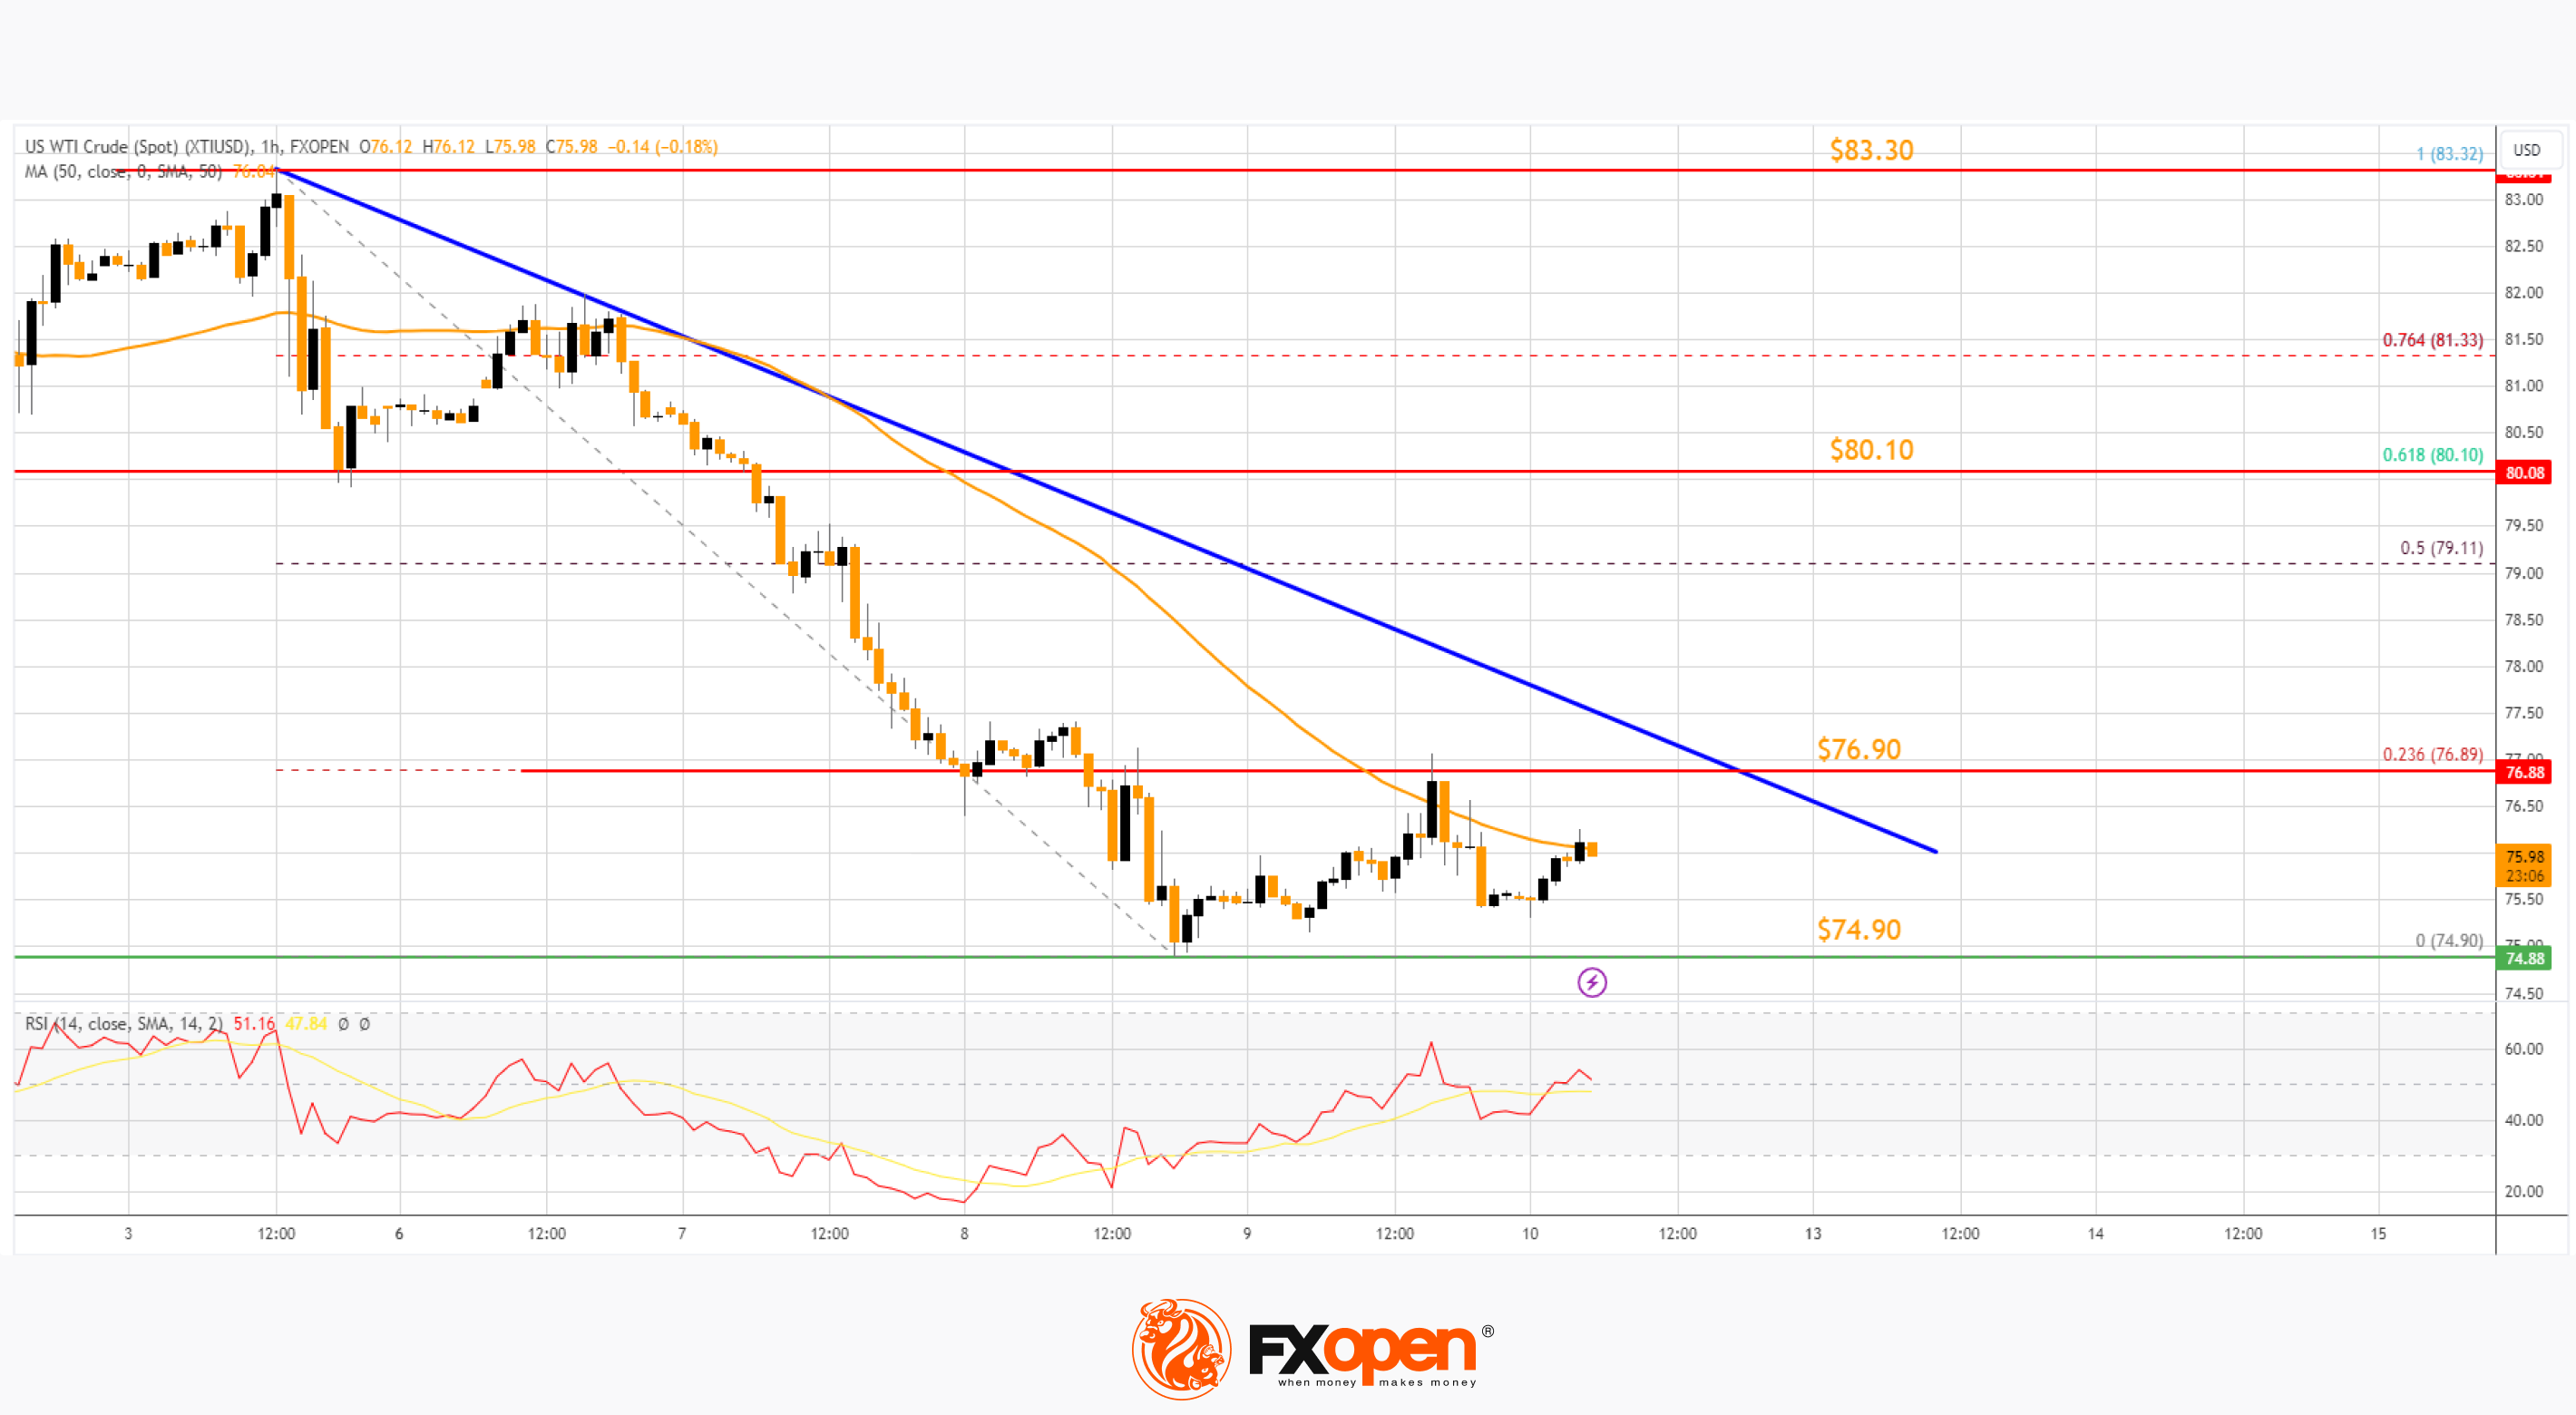
It is stuck near the 50-hour simple moving average. Immediate support is near the $74.90 level. The next major support on the WTI crude oil chart is near $74.20. If there is a downside break, the price might decline toward $72.50. Any more losses may perhaps open the doors for a move toward the $70.00 support zone.
On the upside, immediate resistance is near a key bearish trend line at $76.90. The trend line is near the 23.6% Fib retracement level of the downward move from the $83.32 swing high to the $74.90 low.
A clear move above the trend line resistance could send the price toward $80.10. It coincides with the 61.8% Fib retracement level of the downward move from the $83.32 swing high to the $74.90 low.
The next key resistance is near $83.30. If the price climbs further higher, it could face resistance near $85.00. Any more gains might send the price toward the $88.00 level.
Start trading commodity CFDs with tight spreads (additional fees may apply). Open your trading account now or learn more about trading commodity CFDs with FXOpen.
This article represents the opinion of the Companies operating under the FXOpen brand only. It is not to be construed as an offer, solicitation, or recommendation with respect to products and services provided by the Companies operating under the FXOpen brand, nor is it to be considered financial advice.
Stay ahead of the market!
Subscribe now to our mailing list and receive the latest market news and insights delivered directly to your inbox.


Latest articles

Weak Data Weigh on the Dollar: Market Awaits Trend Confirmation
The US dollar is retreating from recent highs, moving into a moderate correction after a prolonged period of gains. Pressure on the currency is building amid weaker-than-expected macroeconomic data, while market participants adopt a wait-and-see approach ahead of key labour

Market Analysis: EUR/USD Aims Recovery While USD/JPY Gives Back Recent Gains
EUR/USD is recovering losses from 1.1450. USD/JPY is correcting gains from 160.50 and might decline further below 158.00.
Important Takeaways for EUR/USD and USD/JPY Analysis Today
· The Euro struggled to stay in a

European Currencies Decline: Pound Hits New Lows, Euro Under Pressure
European currencies continue to weaken against the US dollar amid rising geopolitical tensions and increased demand for safe-haven and liquid assets. Market participants are reducing exposure to riskier instruments, putting pressure on both the euro and the pound. Additional support