


FXOpen

Gold price rallied above $2,920 before correcting lower. Crude oil price is recovering and it could climb further higher toward the $71.80 resistance.
Important Takeaways for Gold and Oil Prices Analysis Today
· Gold price rallied significantly above $2,900 and recently corrected lower against the US Dollar.
· A key bearish trend line is forming with resistance at $2,870 on the hourly chart of gold at FXOpen.
· Crude oil prices are moving higher above the $68.90 resistance zone.
· There is a connecting bullish trend line forming with support at $69.50 on the hourly chart of XTI/USD at FXOpen.
Gold Price Technical Analysis
On the hourly chart of Gold at FXOpen, the price was able to climb above the $2,900 resistance, as mentioned in the previous analysis. The price even broke the $2,940 level before the bears appeared.
The price traded close to the $2,960 zone before there was a downside correction. There was a move below the $2,900 pivot zone. The price settled below the 50-hour simple moving average and RSI dipped below 50. Finally, it tested the $2,830 zone.
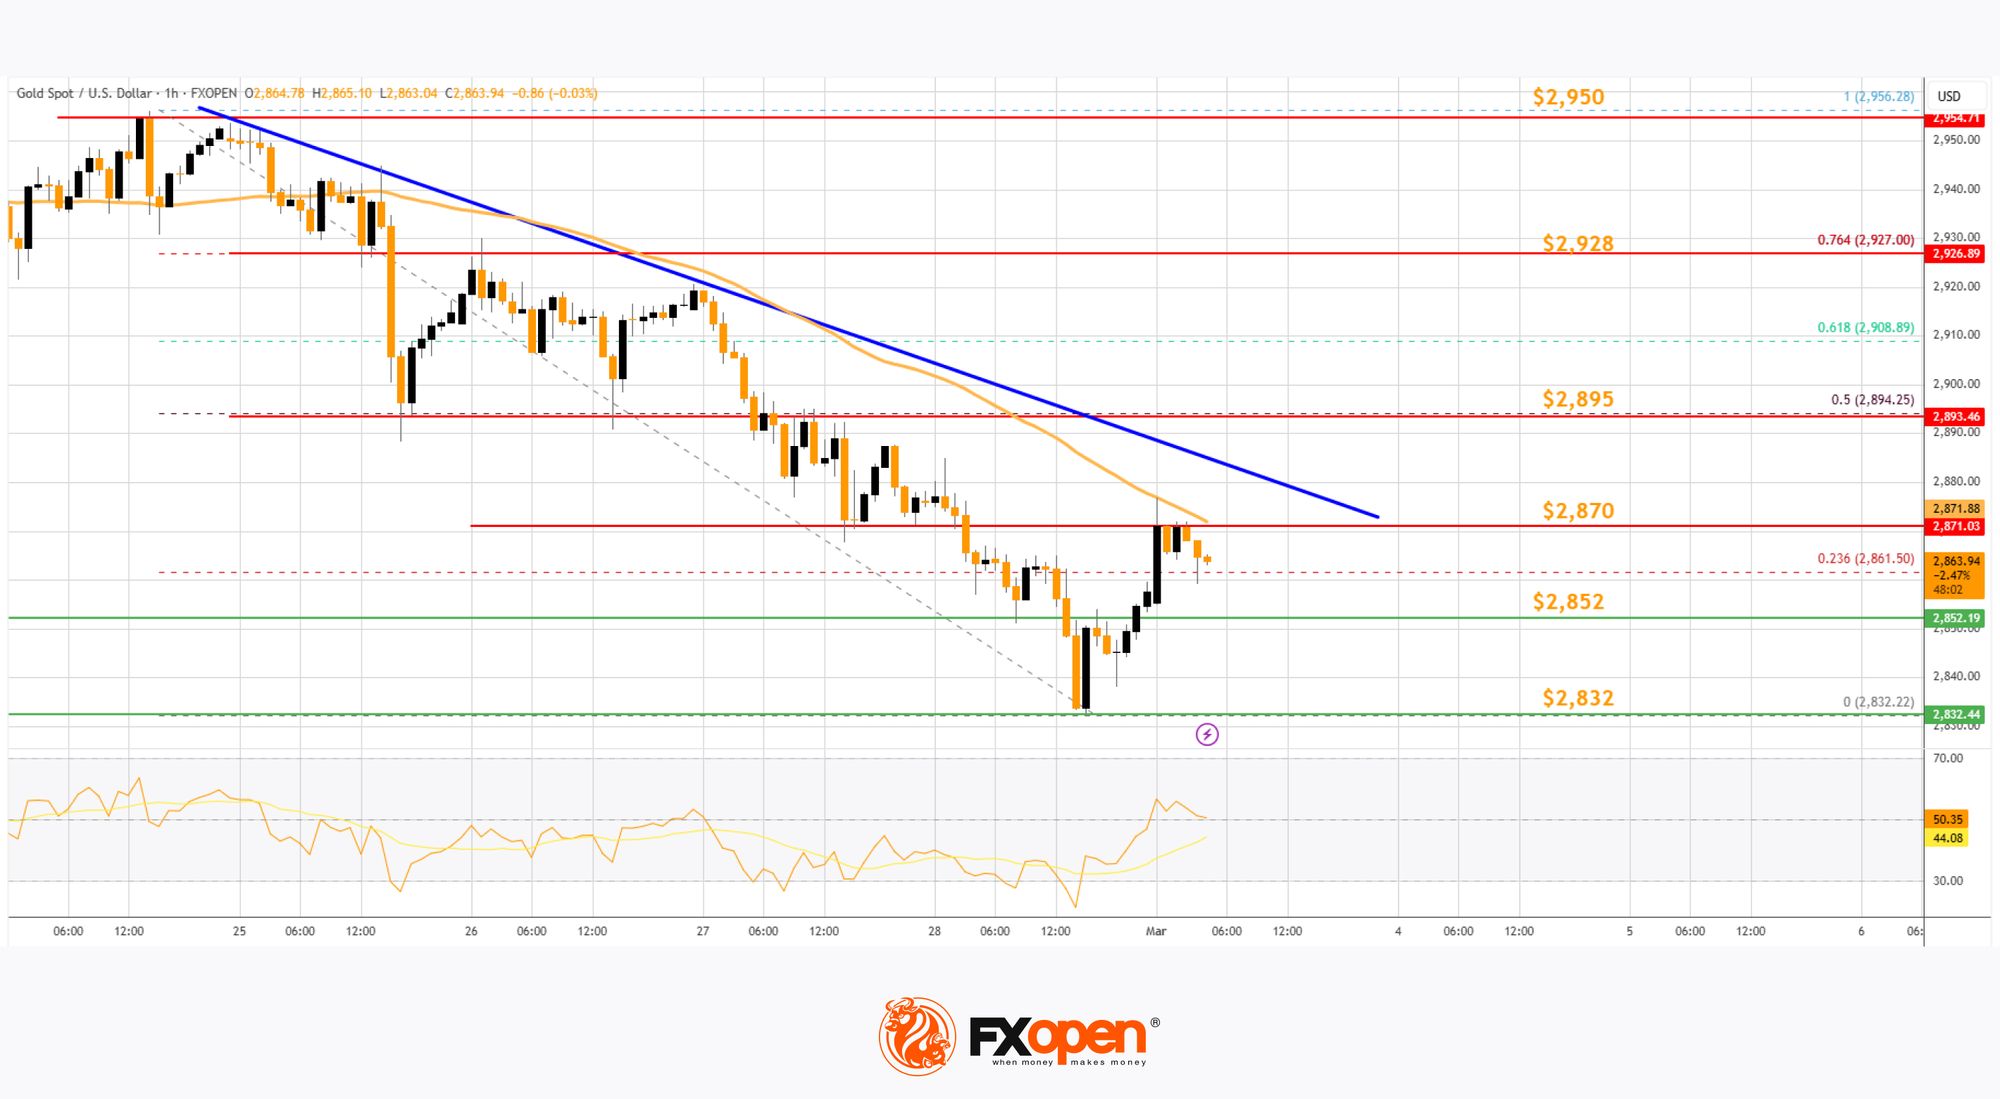
The price is now correcting losses above the 23.6% Fib retracement level of the downward move from the $2,956 swing high to the $2,832 low. Immediate resistance on the upside is near the 50-hour simple moving average and $2,870.
There is also a key bearish trend line forming with resistance at $2,870. The next major resistance is near the 50% Fib retracement level of the downward move from the $2,956 swing high to the $2,832 low at $2,895.
An upside break above the $2,895 resistance could send Gold price toward $2,928. Any more gains may perhaps set the pace for an increase toward the $2,950 level. If there is no fresh increase, the price could continue to move down.
Initial support on the downside is near the $2,852 level. The first major support is $2,832. If there is a downside break below the $2,832 support, the price might decline further. In the stated case, the price might drop toward the $2,810 support.
Oil Price Technical Analysis
On the hourly chart of WTI Crude Oil at FXOpen, the price started a decent increase against the US Dollar. The price gained bullish momentum after it broke the $68.90 resistance.
The bulls pushed the price above the 50-hour simple moving average and the RSI climbed toward 65. There was a clear move above the 50% Fib retracement level of the downward move from the $71.12 swing high to the $68.24 low.
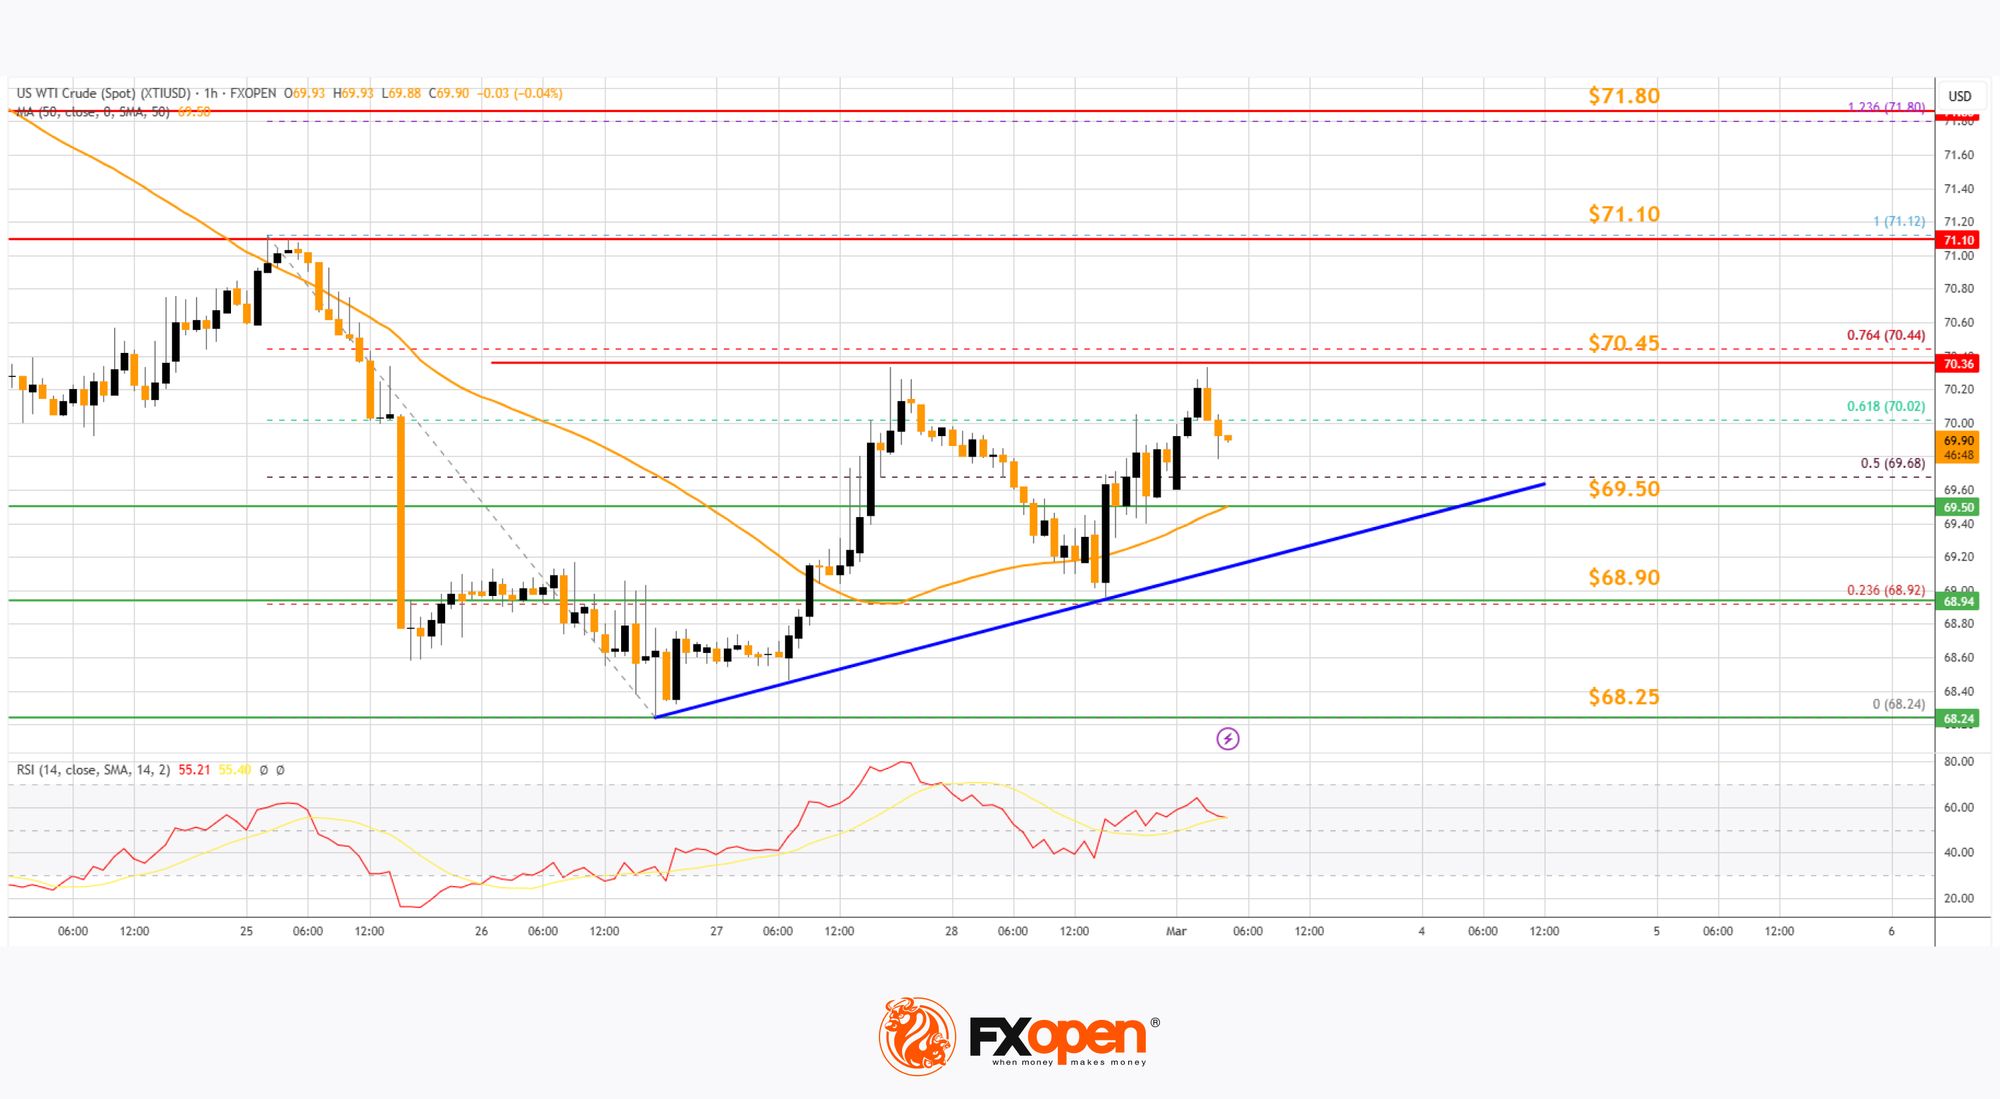
Immediate resistance is near the $70.45 level. It is close to the 76.4% Fib retracement level of the downward move from the $71.12 swing high to the $68.24 low.
If the price climbs further higher, it could face resistance near $71.10. The next major resistance is near the $71.80 level. Any more gains might send the price toward the $72.50 level.
Conversely, the price might correct gains and test the $69.50 support. There is also a connecting bullish trend line forming with support at $69.50 and the 50-hour simple moving average.
The next major support on the WTI crude oil chart is near the $68.90 level. If there is a downside break, the price might decline toward $68.25. Any more losses may perhaps open the doors for a move toward the $66.50 support zone.
Start trading commodity CFDs with tight spreads (additional fees may apply). Open your trading account now or learn more about trading commodity CFDs with FXOpen.
This article represents the opinion of the Companies operating under the FXOpen brand only. It is not to be construed as an offer, solicitation, or recommendation with respect to products and services provided by the Companies operating under the FXOpen brand, nor is it to be considered financial advice.
Stay ahead of the market!
Subscribe now to our mailing list and receive the latest market news and insights delivered directly to your inbox.


Latest articles

Dollar Index (DXY) Hits Yearly High
Today, the dollar index rose above last week’s peak around the 99.68 level, setting a new high for 2026. This movement is supported by a tense fundamental backdrop:
→ Inflationary pressures from rising oil prices. Markets may be pricing

WTI Oil Price Rises Above $100
Another shocking Monday for the energy market. Last week’s start was remembered for a bullish gap of more than 10% (which was later followed by a pullback), but today’s market open proved even more volatile (as reflected by

Market Analysis: AUD/USD and NZD/USD Struggle as Market Jitters Shake Risk Sentiment
AUD/USD failed to stay in a positive zone and declined below 0.7000. NZD/USD is also moving lower and might extend losses below 0.5850.
Important Takeaways for AUD/USD and NZD/USD Analysis Today
· The Aussie Dollar