


FXOpen

Gold price rallied further and traded to a new all-time high. Crude oil is attempting a recovery wave but upsides could be limited.
Important Takeaways for Gold and WTI Crude Oil Prices Analysis Today
· Gold price started a steady increase above the $3,000 zone against the US Dollar.
· A connecting bearish trend line is forming with resistance at $3,028 on the hourly chart of gold at FXOpen.
· WTI Crude oil prices started a recovery wave from the $66.00 support zone.
· There is a key bullish trend line forming with support at $67.50 on the hourly chart of XTI/USD at FXOpen.
Gold Price Technical Analysis
On the hourly chart of Gold at FXOpen, the price found support near the $2,950 zone. The price remained in a bullish zone and started a strong increase above $2,980.
There was a decent move above the 50-hour simple moving average and $3,000. The bulls pushed the price above the $3,015 and $3,030 resistance levels. Finally, the price climbed as high as $3,057 before there was a pullback.
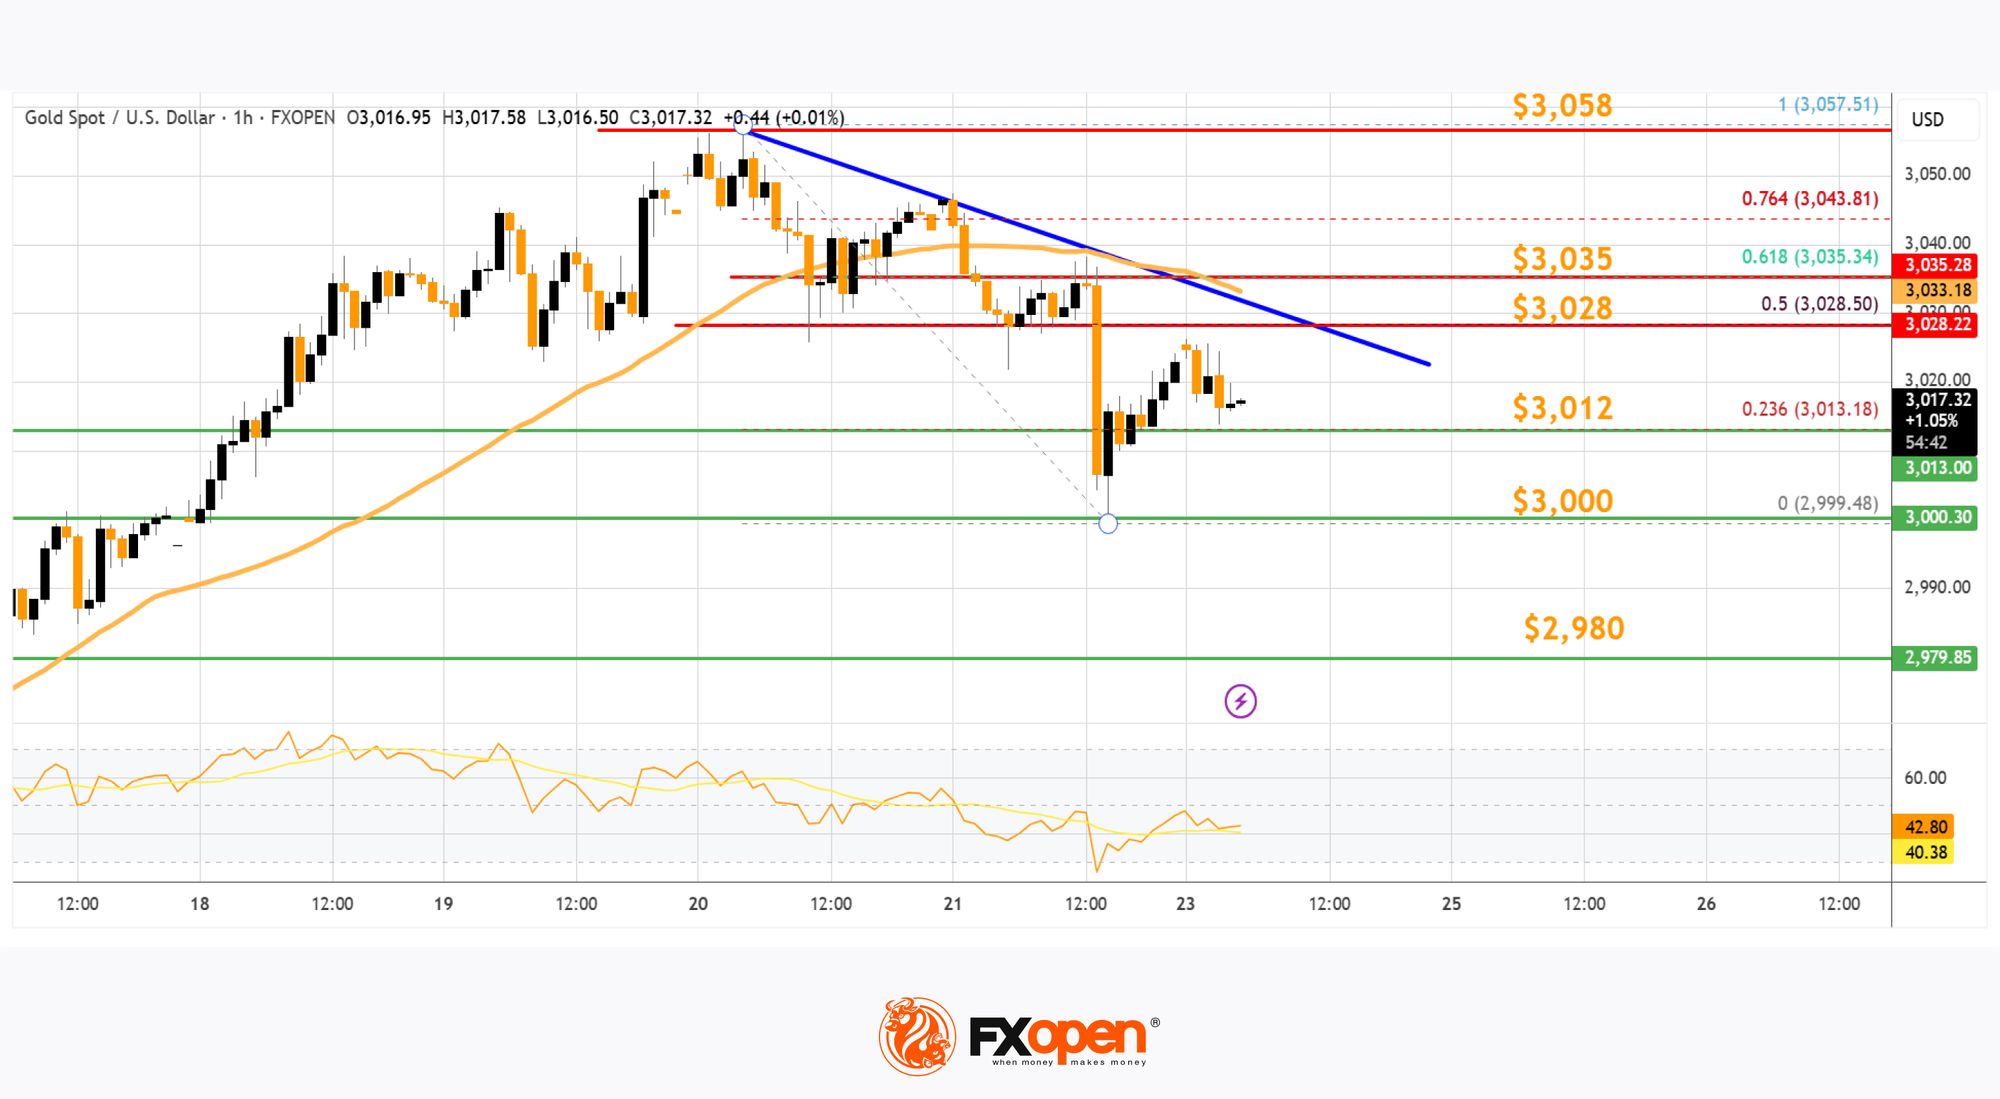
The price tested the $3,000 zone and is currently rising. There was a move above the 23.6% Fib retracement level of the downside correction from the $3,057 swing high to the $2,999 low, and the RSI is stable above 40.
Immediate resistance is near the $3,028 level and the 50% Fib retracement level of the downside correction from the $3,057 swing high to the $2,999 low. There is also a connecting bearish trend line forming with resistance at $3,028.
The next major resistance is near the $3,035 level. An upside break above the $3,035 resistance could send Gold price toward $3,058. Any more gains may perhaps set the pace for an increase toward the $3,080 level.
Initial support on the downside is near the $3,012 level. The first major support is near the $3,000 zone. If there is a downside break below the $3,000 support, the price might decline further.
In the stated case, the price might drop toward the $2,980 zone. Any more losses might push the price toward the $2,965 level.
WTI Crude Oil Price Technical Analysis
On the hourly chart of WTI Crude Oil at FXOpen, the price remained in a bearish zone below the $70.00 level against the US Dollar. The price started a fresh decline below the $68.00 support.
The price even dipped below the $67.50 level and the 50-hour simple moving average. Finally, the bulls appeared near $66.00 and the price started a recovery wave. The price recovered above $67.50 and tested the $68.50 zone.
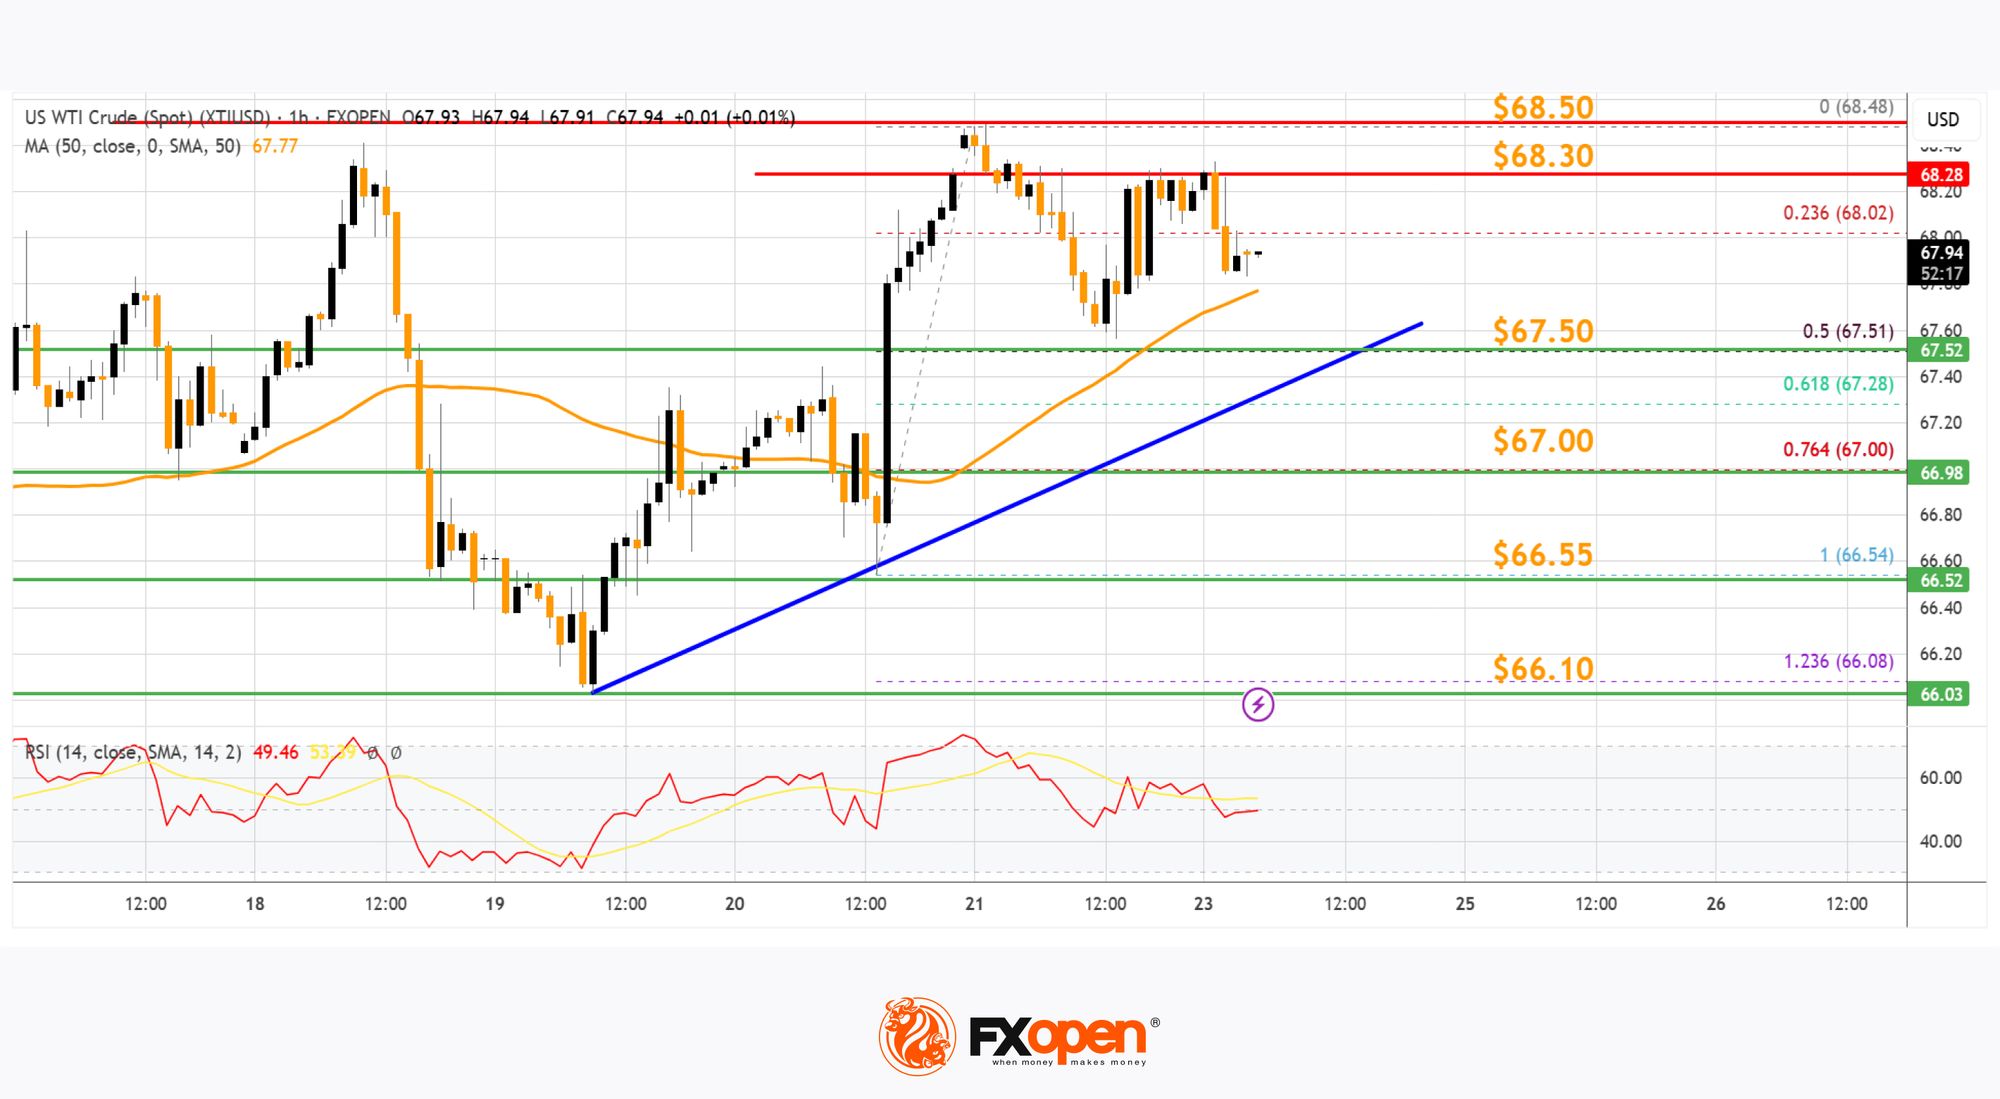
The price is now consolidating gains below the 23.6% Fib retracement level of the upward move from the $66.54 swing low to the $68.48 high. There is also a key bullish trend line forming with support at $67.50.
If there is a fresh increase, it could face resistance near the $68.30 level. The first major resistance is near the $68.50 level. Any more gains might send the price toward the $69.20 level.
The main resistance could be near the $70.00 level. Conversely, the price might continue to move down and revisit the $67.50 support and the 50% Fib retracement level of the upward move from the $66.54 swing low to the $68.48 high. The next major support on the WTI crude oil chart is $67.00.
If there is a downside break, the price might decline toward $66.55. Any more losses may perhaps open the doors for a move toward the $66.10 support zone.
Start trading commodity CFDs with tight spreads (additional fees may apply). Open your trading account now or learn more about trading commodity CFDs with FXOpen.
This article represents the opinion of the Companies operating under the FXOpen brand only. It is not to be construed as an offer, solicitation, or recommendation with respect to products and services provided by the Companies operating under the FXOpen brand, nor is it to be considered financial advice.
Stay ahead of the market!
Subscribe now to our mailing list and receive the latest market news and insights delivered directly to your inbox.


Latest articles

Market Insights with Gary Thomson: USD, CAD, and Commodities in Focus
In this video, we’ll explore the key economic events and market trends, shaping the financial landscape. Get ready for insights into financial markets to help you navigate the week ahead. Let’s dive in!
In this episode of Market

USD/CHF Exchange Rate Rebounds from Multi-Year Low
The resilience of the Swiss economy and inflation remaining below 1% have made the Swiss franc an attractive safe-haven asset amid an extremely tense geopolitical backdrop and elevated gold prices. As the USD/CHF chart shows, the US dollar fell

Palantir Technologies (PLTR) Shares Show Strong Growth at the Beginning of March
Shares of Palantir Technologies (PLTR), a company specialising in big data analytics software, have become one of the stock market’s standout performers at the start of this spring.
While the closing price on the last trading day of February