


FXOpen

Gold price started a fresh surge above $4,000 and traded to a new all-time high. Crude oil is recovering and might rise toward the $63.20 resistance zone.
Important Takeaways for Gold and WTI Crude Oil Prices Analysis Today
· Gold price rallied to a new all-time high and traded above $4,000 against the US Dollar.
· A key bullish trend line is forming with support at $4,000 on the hourly chart of gold at FXOpen.
· WTI Crude oil is recovering losses and trading above $61.20.
· There is a short-term rising channel in place with support at $61.20 on the hourly chart of XTI/USD at FXOpen.
Gold Price Technical Analysis
On the hourly chart of Gold at FXOpen, the price formed support near $3,820. The price remained in a bullish zone and started a fresh increase above $3,900, as mentioned in the previous analysis.
The bulls pushed the price above $4,000 level and the 50-hour simple moving average. Finally, it traded to a new all-time high at $4,026. The price is still showing bullish signs above $4,020 and the RSI is above 70.
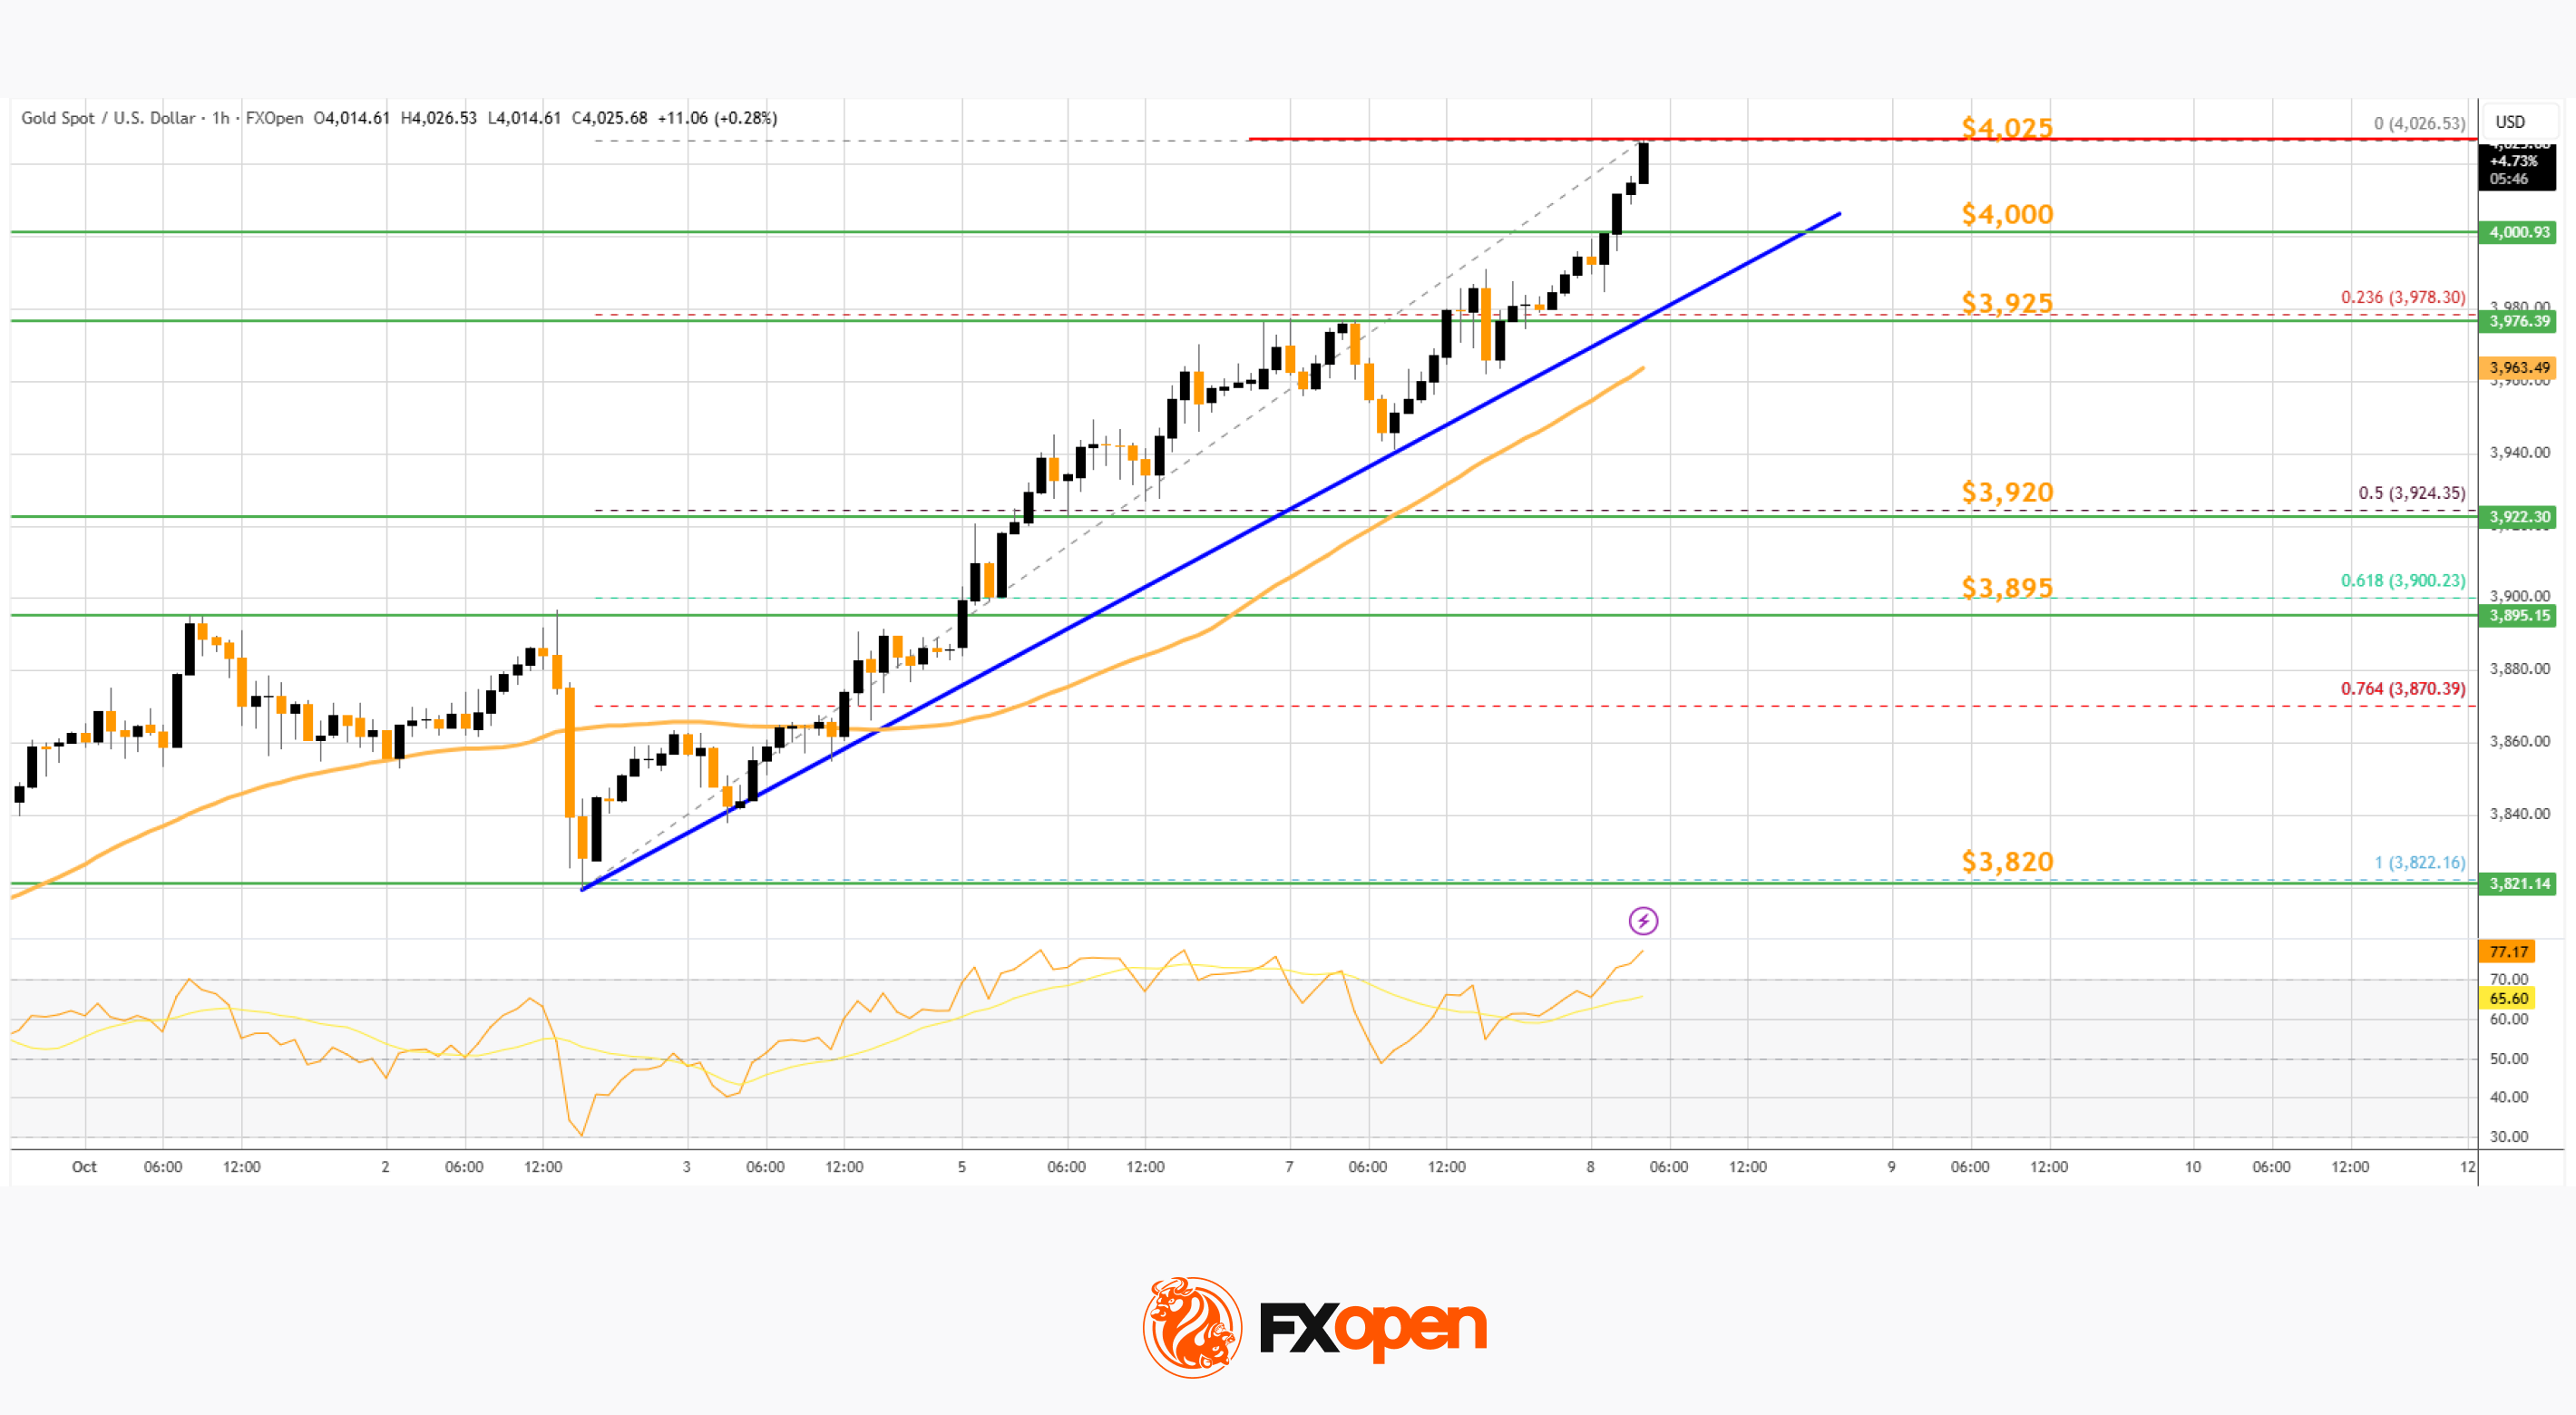
Initial support on the downside is near a key bullish trend line at $4,000. A downside break below the trend line might send the price to the 23.6% Fib retracement level of the upward move from the $3,822 swing low to the $4,026 high at $3,925.
If the bulls fail to protect $3,925, the price could start a larger downside correction. In the stated case, Gold could drop toward the 50% Fib retracement at $3,920. The next area of interest for the bulls might be $3,895. A daily close below $3,895 could spark bearish moves and send the price to $3,820.
If there is a fresh increase, the price could face resistance at $4,025. The next sell zone might be $4,050. An upside break above the $4,050 resistance could send Gold price toward $4,120. Any more gains may perhaps set the pace for an increase to $4,200.
WTI Crude Oil Price Technical Analysis
On the hourly chart of WTI Crude Oil at FXOpen, the price found support near $60.25 against the US Dollar. The price formed a base and started a recovery wave above $60.80 and the 50-hour simple moving average.
The bulls were able to push the price above the 23.6% Fib retracement level of the downward move from the $66.16 swing high to the $60.26 swing low. The hourly RSI is above the 60 level, but the price is struggling near $62.00.
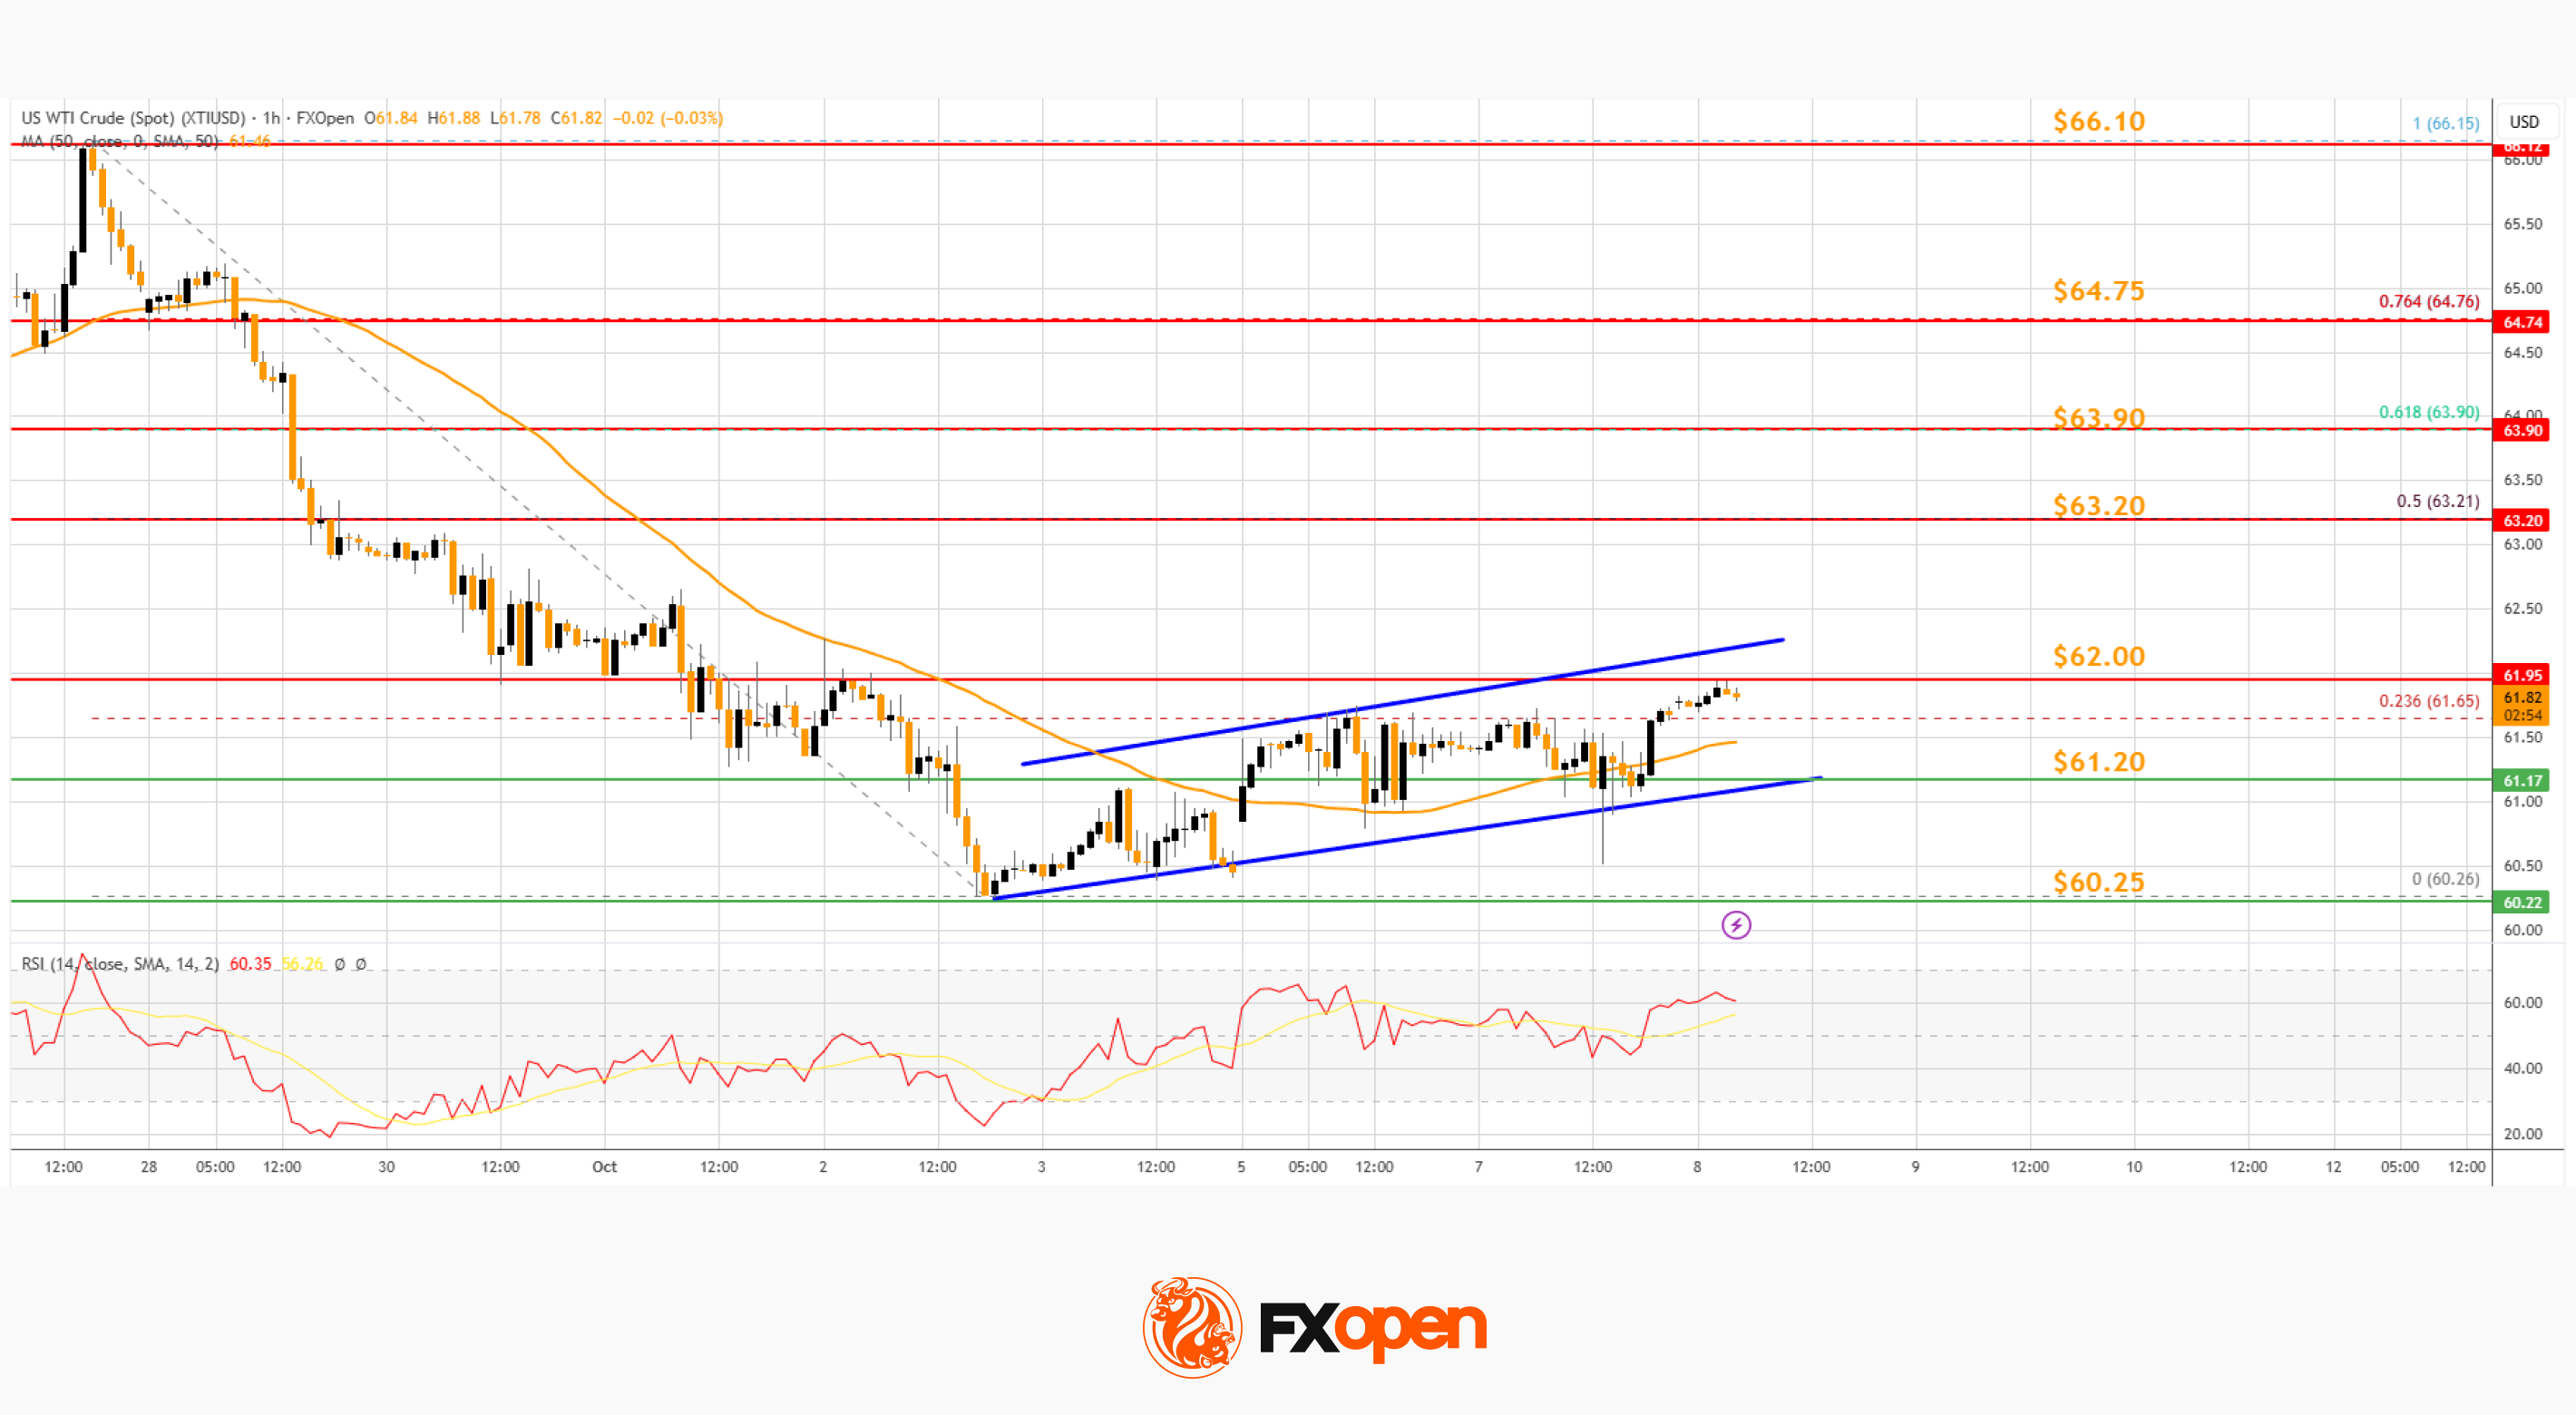
The next hurdle could be $63.20 and the 50% Fib retracement. A clear move above $63.20 could send the price toward $63.90. Any more gains might open the doors for a test of $64.75.
Conversely, the price might start a fresh decline from $62.00. Immediate support sits near $61.20 and the 50-hour simple moving average. There is also a short-term rising channel in place at $61.20. The key breakdown zone on the WTI crude oil chart might be $60.25.
If there is a downside break, the price might decline toward $58.40. Any more losses might encourage the bears for a push toward $55.00.
Start trading commodity CFDs with tight spreads (additional fees may apply). Open your trading account now or learn more about trading commodity CFDs with FXOpen.
This article represents the opinion of the Companies operating under the FXOpen brand only. It is not to be construed as an offer, solicitation, or recommendation with respect to products and services provided by the Companies operating under the FXOpen brand, nor is it to be considered financial advice.
Stay ahead of the market!
Subscribe now to our mailing list and receive the latest market news and insights delivered directly to your inbox.


Latest articles

US Dollar Index (DXY) Analysis: FX Markets Await Central Bank Decisions
Today, the focus for FX traders is on the Federal Reserve: at 21:00 GMT+3, the FOMC will announce its interest rate decision (rates are expected to remain unchanged), followed by a press conference with Fed Chair Jerome Powell

Market Analysis: EUR/USD Rebound Continues as USD/CHF Nears Key Inflection Point
EUR/USD is attempting a recovery wave from the 1.1400 zone. USD/CHF climbed higher above 0.7900 before it started a downside correction.
Important Takeaways for EUR/USD and USD/CHF Analysis Today
· The Euro declined toward 1.

BTC/USD Analysis: Bitcoin Price Reaches March High
Yesterday, BTC/USD rose above the $75k level, thereby setting a new high for March. The last time Bitcoin traded at such levels was in early February.
Why is Bitcoin Rising?
Bitcoin’s appeal appears to be increasing due to