


Market Analysis: Gold Slips As WTI Crude Oil Rally Gains Fresh Momentum
FXOpen

Gold price extended losses below $4,650 before the bulls appeared. WTI Crude oil prices are rising and could climb further higher toward $105.
Important Takeaways for Gold and WTI Crude Oil Prices Analysis Today
· Gold price failed to clear $4,800 and declined steadily against the US Dollar.
· There is a key bearish trend line forming with resistance at $4,625 on the hourly chart of gold at FXOpen.
· WTI Crude oil prices are moving higher above the $100.00 pivot zone.
· There is a connecting bullish trend line forming with support at $101.80 on the hourly chart of XTI/USD at FXOpen.
Gold Price Technical Analysis
On the hourly chart of Gold at FXOpen, the price failed to settle above $4,800 and reacted to the downside, as discussed in the previous analysis. The price traded below $4,750 and $4,700 to enter a short-term bearish zone.
There was a sharp drop below $4,650. The price settled below the 50-hour simple moving average, and RSI dipped below 30. Finally, it tested the $4,480 zone. A low was formed at $4,480, and the price is now correcting some losses.
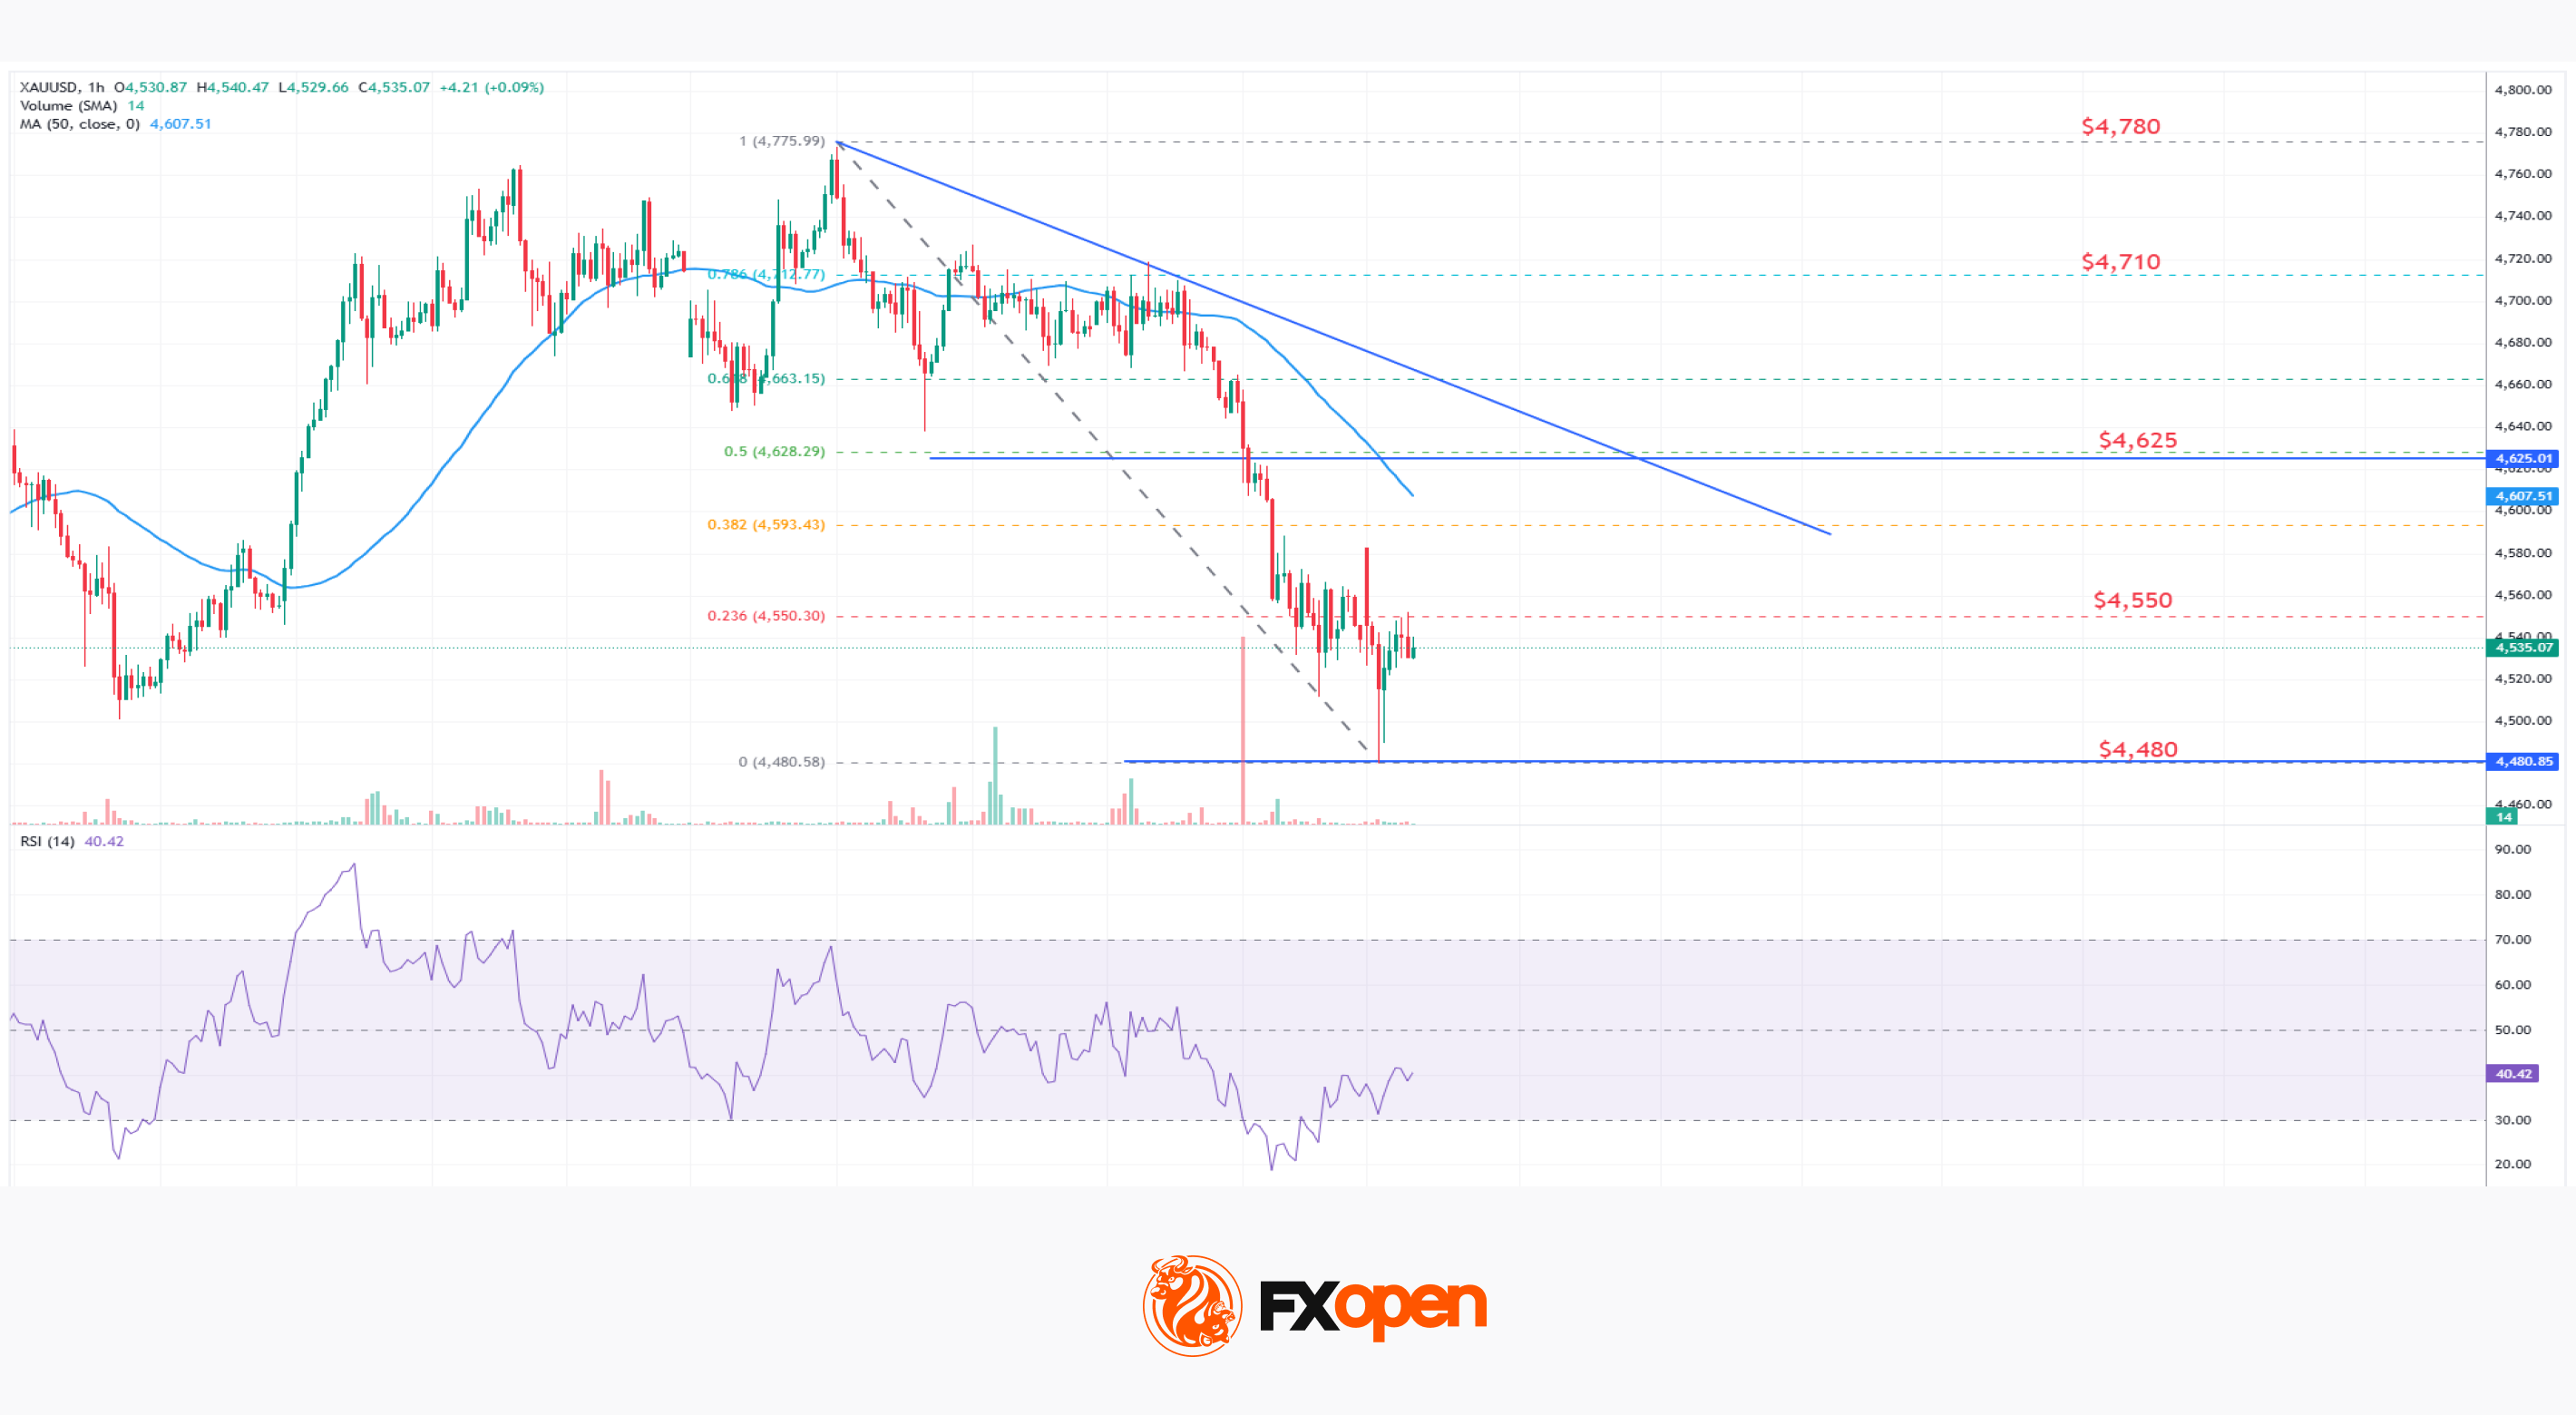
Immediate hurdle on the upside is $4,550 or the 23.6% Fib retracement level of the downward move from the $4,775 swing high to the $4,480 low. The first major barrier for the bulls could be $4,625 and the 50% Fib retracement. There is also a key bearish trend line forming with resistance at $4,625.
A close above $4,625 could initiate a recovery wave to $4,710. An upside break above $4,710 could send Gold price toward $4,780. Any more gains may perhaps set the pace for an increase toward $5,000.
If there is no fresh increase, the price could continue to move down. Initial support on the downside is near the $4,480 level. The first key area of interest might be $4,420. If there is a downside break below $4,420, the price might decline further. In the stated case, the price might drop to $4,200.
WTI Crude Oil Price Technical Analysis
On the hourly chart of WTI Crude Oil at FXOpen, the price started a fresh increase from $95.20 against the US Dollar. The price gained bullish momentum after it broke $98.00.
There was a sustained upward movement above $99.50 and $100.00. The bulls pushed the price above the 50-hour simple moving average, and the RSI climbed toward 80. A high was formed near $103.85 before there was a minor pullback. The price declined toward the 23.6% Fib retracement level of the upward move from the $95.23 swing low to the $103.85 high.
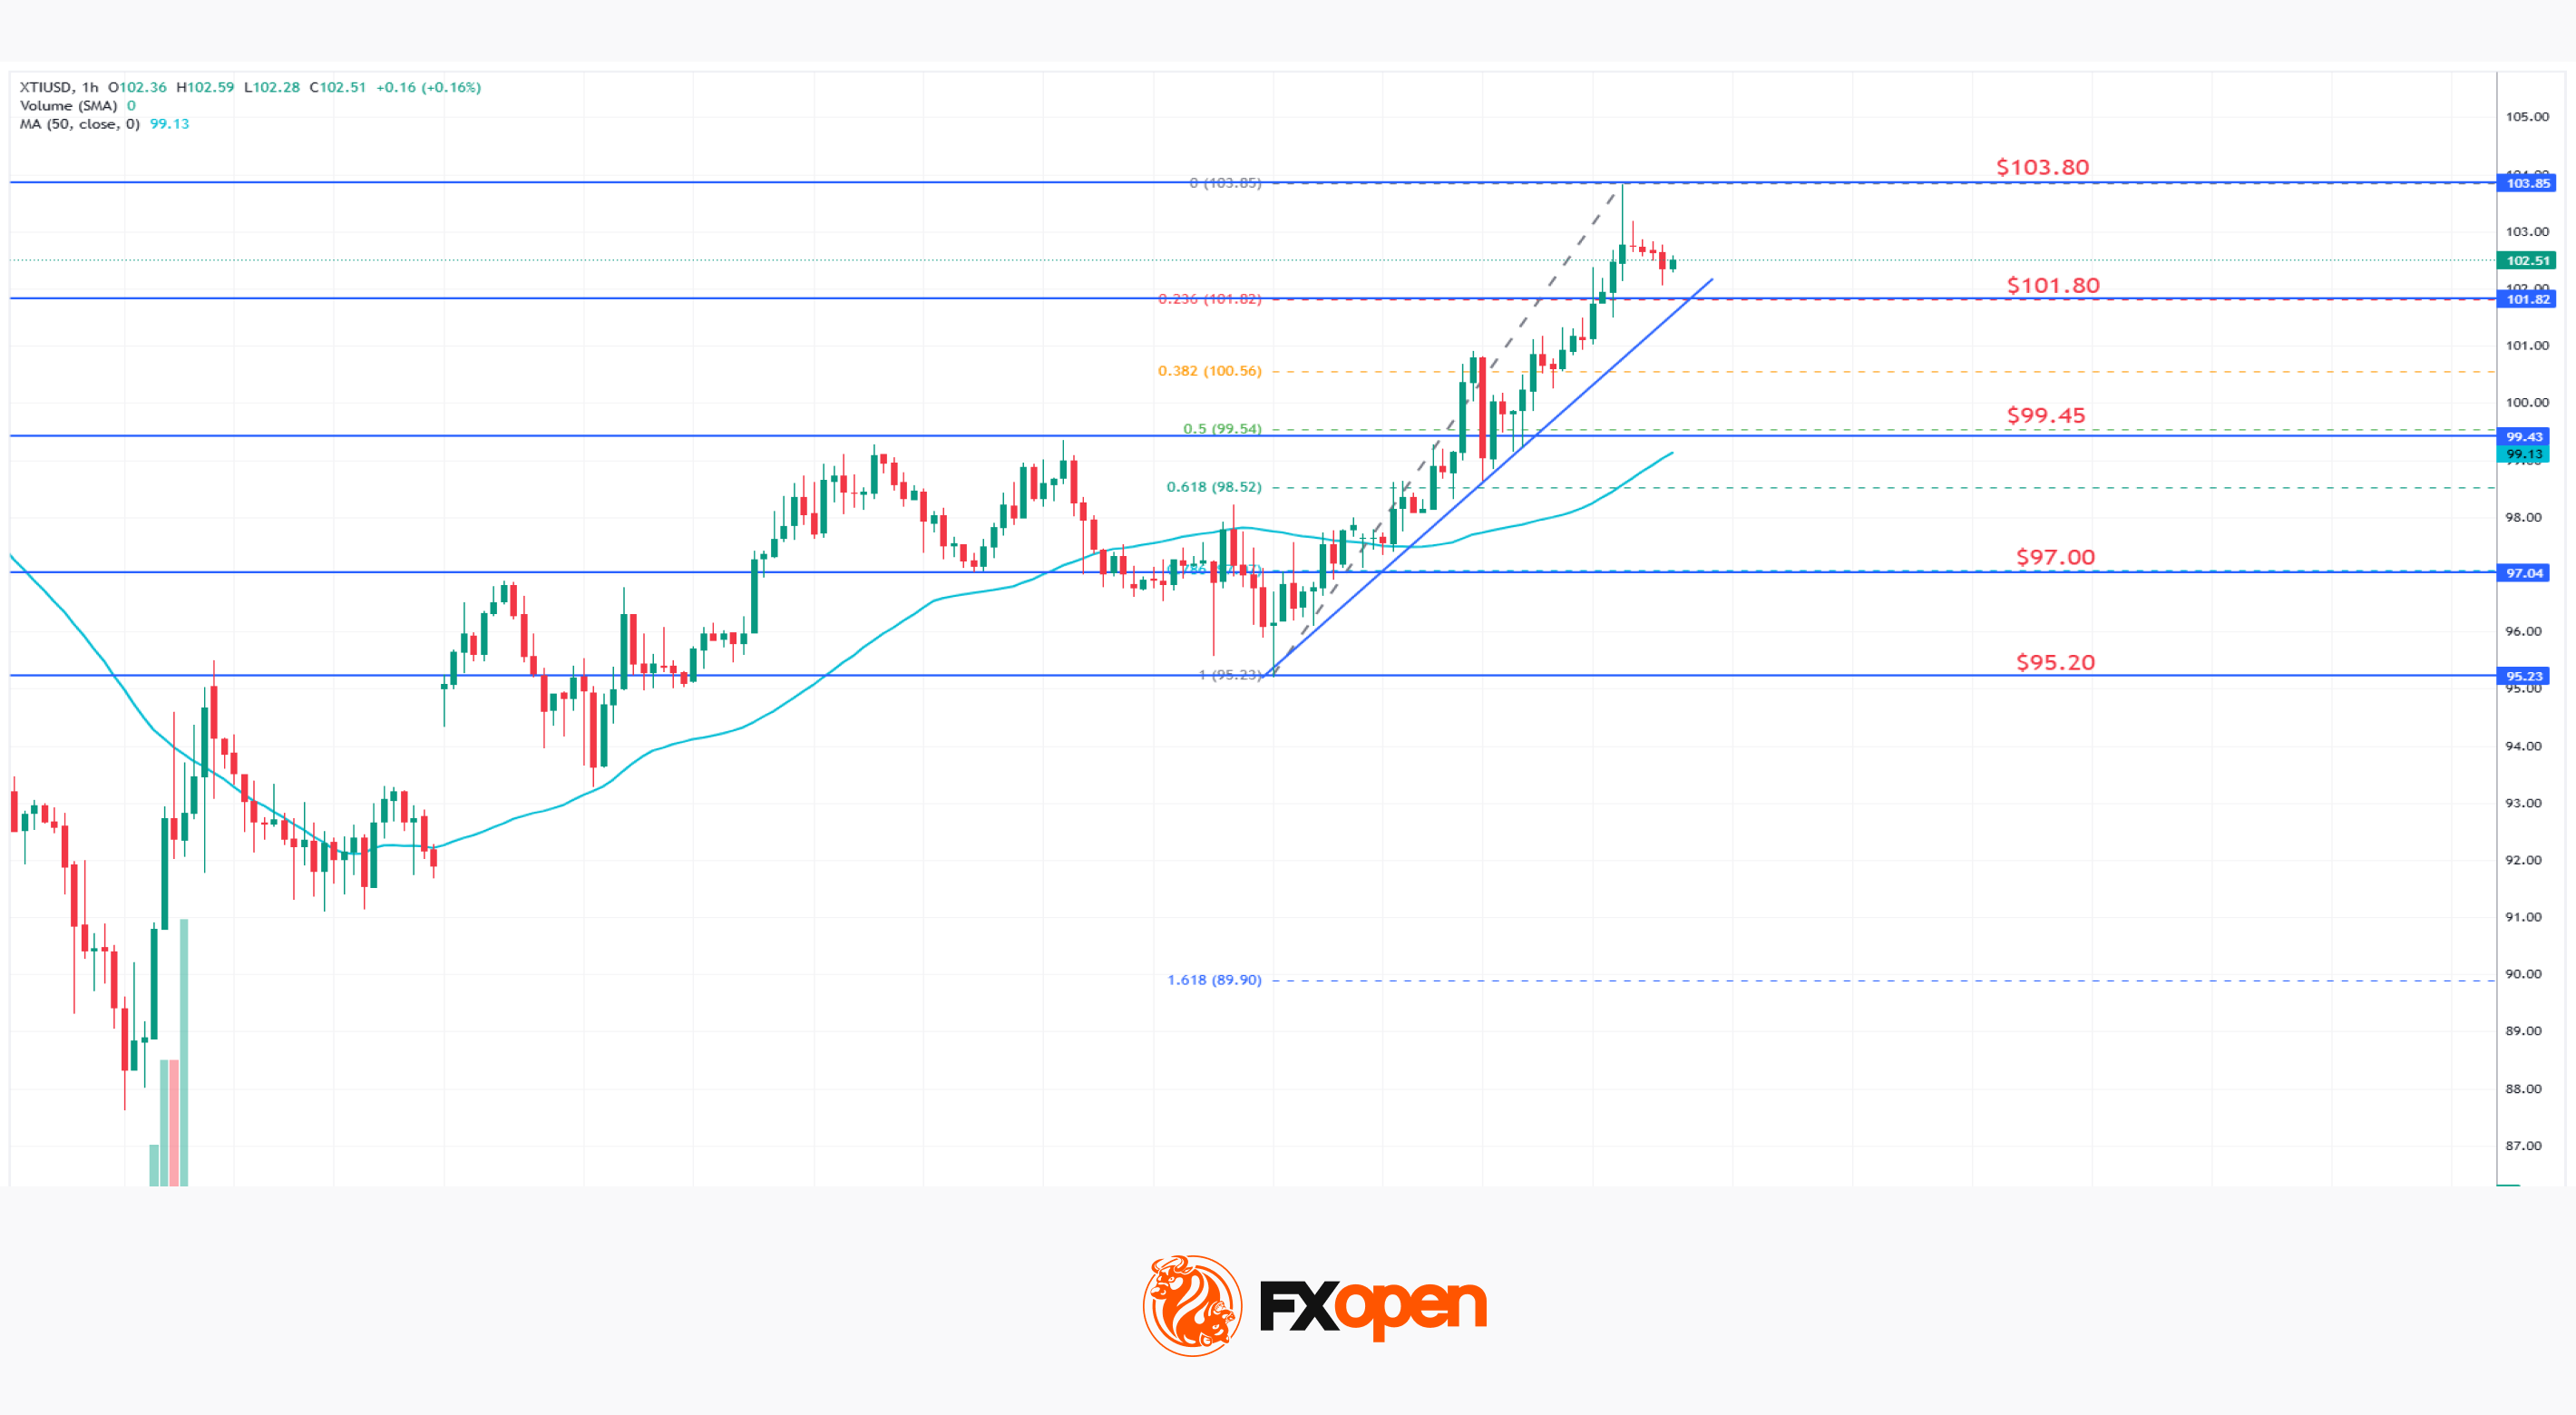
However, the bulls are active above $102.00. Immediate resistance is near $103.80. If the price climbs further, it could face hurdles near $104.25.
The next major stop for the bulls might be $105.00. Any more gain might send the price toward $106.50. Conversely, the price might correct gains and test a connecting bullish trend line with support at $101.80.
The next area of interest on the WTI crude oil chart could be $99.45 and the 50% Fib retracement. If there is a downside break, the price might decline to $97.00. Any more losses may perhaps open the doors for a move toward $95.20.
Start trading commodity CFDs with tight spreads (additional fees may apply). Open your trading account now or learn more about trading commodity CFDs with FXOpen.
This article represents the opinion of the Companies operating under the FXOpen brand only. It is not to be construed as an offer, solicitation, or recommendation with respect to products and services provided by the Companies operating under the FXOpen brand, nor is it to be considered financial advice.
Stay ahead of the market!
Subscribe now to our mailing list and receive the latest market news and insights delivered directly to your inbox.


Latest articles

Pound Weakens After Soft UK Inflation Data as Euro Awaits Fresh Market Signals
The pound remains under pressure following the release of weaker-than-expected UK inflation data. The slowdown in inflation has strengthened expectations that the Bank of England could adopt a more accommodative policy stance in the coming months, weighing on sterling. Meanwhile,

Alphabet: Record Profit as Markets Await Their Verdict
On 22 July, Alphabet reported its Q2 2026 results, with revenue rising 24% year-on-year to $119.8 billion. Google Cloud revenue surged 82% to $24.77 billion, comfortably exceeding analysts' expectations. Search advertising generated $63.3 billion in revenue (+17%

NZD/USD Analysis: A Tug-of-War at the Critical Level
The kiwi has strengthened meaningfully against most peers this month. However, against the US dollar specifically, NZD/USD remains well below its 2026 highs, trading in the mid-0.58 area versus January's peak near 0.6075.
New Zealand's Q2 inflation