


FTSE 100: Correction Has Ended, but a New Impulse Has Yet to Form
FXOpen

Fundamental backdrop
The UK inflation report for April, published on 20 May, delivered unexpectedly positive figures: annual inflation slowed to 2.8% in April 2026 from 3.3% in March, coming in below the consensus forecast of 3.0% and marking the lowest reading since March last year.
Nevertheless, the relief is being viewed as temporary. The unresolved conflict involving Iran continues to exert pressure on oil prices, while the Bank of England maintains a cautious approach towards rate cuts, unwilling to move ahead of incoming inflation data.
Technical picture
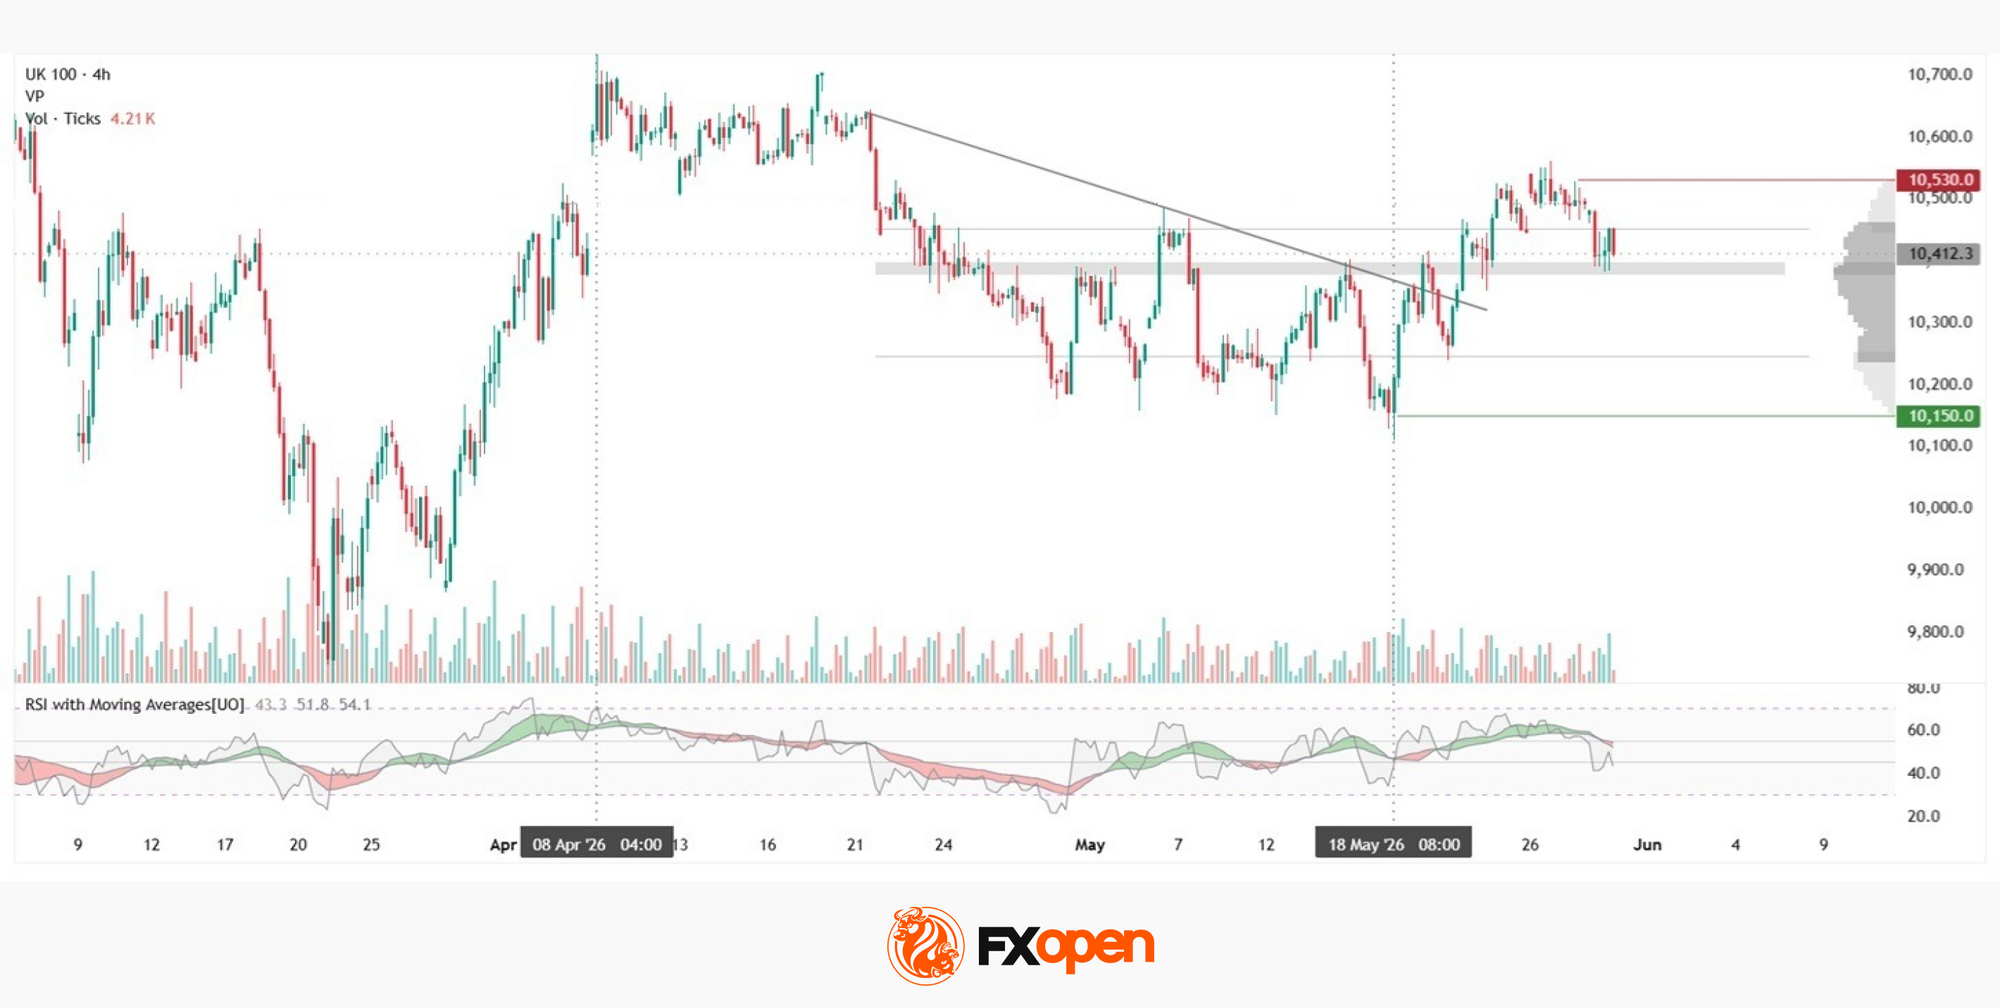
From 8 April to mid-May, the FTSE 100 index (UK100 on FXOpen) remained in a corrective decline: from the 10,700 area, price moved actively lower, but was soon supported by demand, followed by a further compression of quotations around 10,150. In the latter part of May, the trendline was broken to the upside; however, the index failed to establish itself above the upper boundary of the current profile near 10,450 — the latest candlesticks are forming within the range between the POC zone and the aforementioned profile boundary.
The point of control (POC) is concentrated around 10,380–10,390, where the highest trading activity within the current range is located. Should price break higher from the profile, the 10,530 area could become a serious obstacle for buyers. In the event of renewed selling pressure, the lower boundary of the profile near 10,250 may come back into focus, while the 10,150 area represents the next significant reference point.
RSI + MAs currently show a reading of 43, with the indicator positioned below both moving averages (51 and 54), which also casts doubt on the strength of the breakout.
Key takeaways
The descending trendline has been broken, yet RSI remaining below its moving averages points to weak momentum. The nature of the next move will largely depend on how the market reacts to expected Bank of England signals regarding the future rate path against the backdrop of temporarily slowing inflation.
Trade global index CFDs with zero commission and tight spreads (additional fees may apply). Open your FXOpen account now or learn more about trading index CFDs with FXOpen.
This article represents the opinion of the Companies operating under the FXOpen brand only. It is not to be construed as an offer, solicitation, or recommendation with respect to products and services provided by the Companies operating under the FXOpen brand, nor is it to be considered financial advice.
Stay ahead of the market!
Subscribe now to our mailing list and receive the latest market news and insights delivered directly to your inbox.


Latest articles

CAD/JPY: The Yen's Most Historic Move in 30 Years Meets a Fragile Support
Two central banks are heading in genuinely opposite directions this week, and the tension is unmistakable. The Bank of Canada held rates steady at 2.25% on September 2, with a mildly hawkish tilt as policymakers acknowledged a broadening economic

USD/JPY and USD/CAD Await Key Fed Decision
The US dollar is consolidating against the yen and Canadian dollar ahead of the key event of the week — the Federal Reserve meeting. The Fed is widely expected to raise its policy rate by 25 basis points to a range

UnitedHealth: Fundamentals Are Healing, Now the Chart Must Agree
UnitedHealth finds itself in a genuinely split narrative right now, trading near $388, down about 15.9% from its 52-week high, even as the fundamental picture keeps improving. Q2 earnings beat expectations, with revenue of $112.03 billion, and the