


Gold: Attempt to Break Out of the Short-Term Trend
FXOpen

Fundamental backdrop
In April, US inflation stood at 3.8% year-on-year — the highest level since May 2023. A significant contribution came from rising fuel prices amid escalating tensions in the Middle East. Market reaction was somewhat paradoxical: instead of inflows into safe-haven assets, the strong CPI print triggered a reassessment of Federal Reserve monetary policy. Expectations of a possible rate hike by the end of the year appear to have strengthened the US dollar and weighed on gold.
By the end of May, the precious metal had lost more than 4% and is currently trading roughly 20% below its January record high. Markets are now awaiting labour market data and comments from Federal Reserve officials as key guidance for the next reassessment of monetary expectations.
Technical picture
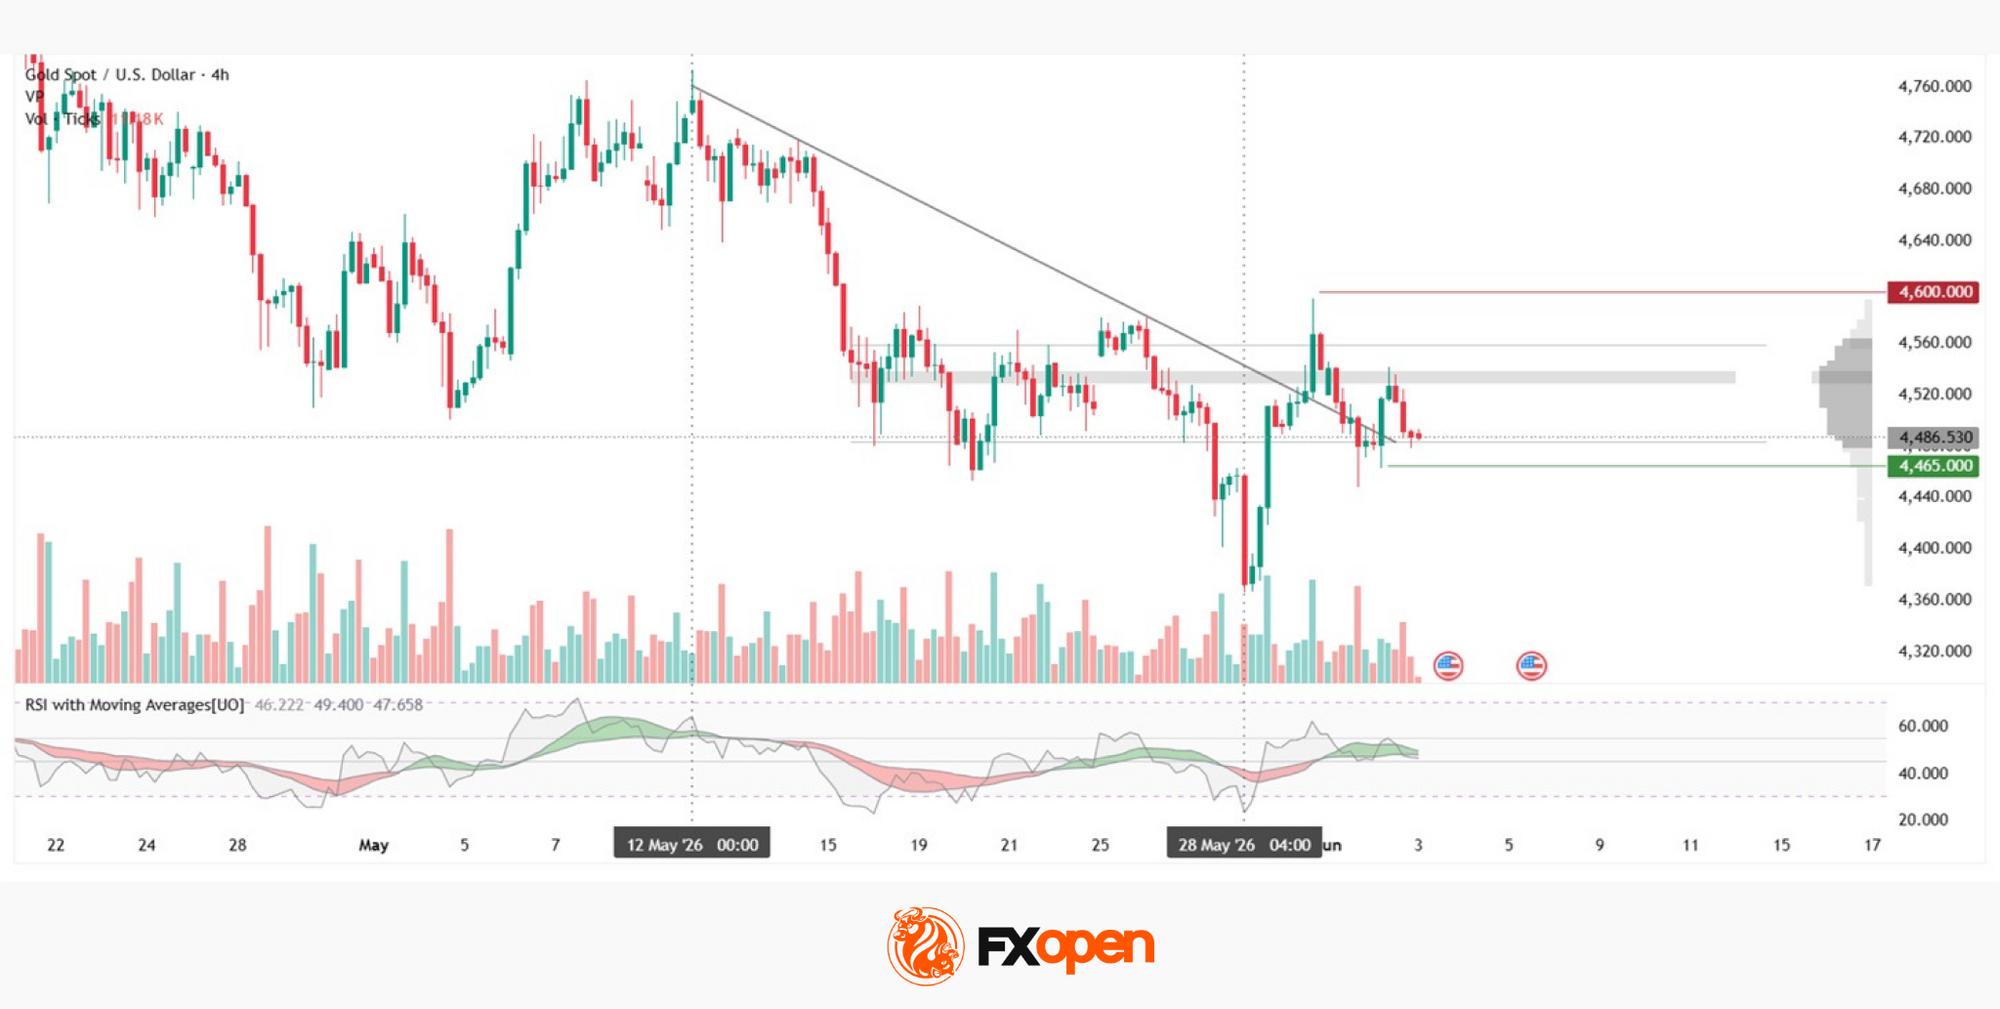
On the four-hour chart of Gold, a short-term bearish trend can be identified: starting on 12 May and ending in a phase of acceleration on 28 May. The trendline is drawn across consecutively lower highs and is clearly defined. Following the 28 May impulse, price reversed sharply and attempted to break above the trendline. However, it has not yet managed to hold above it — the move may be viewed as an incomplete retest of trend strength, with the final outcome still undecided.
The horizontal volume profile defines the current working range, with the upper boundary located around 4,560 and the lower boundary at 4,485. The point of control (POC) is concentrated between 4,533 and 4,535. At present, price is testing the lower boundary of the profile — if this support is lost, attention could shift towards the 4,465 area, where a key support level is located. The 4,600 area could also attract interest if the upward move continues.
RSI + MAs shows readings of 46, 49 and 47 — the oscillator remains in neutral territory but is poised for a potential new impulse.
Key takeaways
Further gold price dynamics will largely depend on US labour market data and Federal Reserve rhetoric: confirmation of expectations for higher rates could increase pressure on the asset. The technical picture remains mixed — the attempted breakout above the descending trendline has not been confirmed, while RSI does not provide a clear directional advantage for either side.
Start trading commodity CFDs with tight spreads (additional fees may apply). Open your trading account now or learn more about trading commodity CFDs with FXOpen.
This article represents the opinion of the Companies operating under the FXOpen brand only. It is not to be construed as an offer, solicitation, or recommendation with respect to products and services provided by the Companies operating under the FXOpen brand, nor is it to be considered financial advice.
Stay ahead of the market!
Subscribe now to our mailing list and receive the latest market news and insights delivered directly to your inbox.


Latest articles

CAD/JPY: The Yen's Most Historic Move in 30 Years Meets a Fragile Support
Two central banks are heading in genuinely opposite directions this week, and the tension is unmistakable. The Bank of Canada held rates steady at 2.25% on September 2, with a mildly hawkish tilt as policymakers acknowledged a broadening economic

USD/JPY and USD/CAD Await Key Fed Decision
The US dollar is consolidating against the yen and Canadian dollar ahead of the key event of the week — the Federal Reserve meeting. The Fed is widely expected to raise its policy rate by 25 basis points to a range

UnitedHealth: Fundamentals Are Healing, Now the Chart Must Agree
UnitedHealth finds itself in a genuinely split narrative right now, trading near $388, down about 15.9% from its 52-week high, even as the fundamental picture keeps improving. Q2 earnings beat expectations, with revenue of $112.03 billion, and the