


Nasdaq-100: Price Concentrates Within the Market Profile Zone
FXOpen

Last week was one of the worst for US technology stocks since the beginning of 2026, with the index losing around 4.6% under the influence of two opposing factors. Firstly, the market continued to reassess the pace of returns on AI infrastructure investment — concerns that spending is outpacing actual returns triggered a sell-off in semiconductor stocks, with the Philadelphia Semiconductor Index falling nearly 8% over the week. Secondly, the US-Iran conflict surrounding the Strait of Hormuz escalated over the weekend: Tehran claimed responsibility for attacks on commercial vessels, while the US responded with air strikes. By Monday morning, tensions had eased somewhat as both sides announced a temporary halt to hostilities and agreed to hold talks in Doha on Tuesday. Against this backdrop, Nasdaq-100 futures gained around 1.1%.
Technical Picture
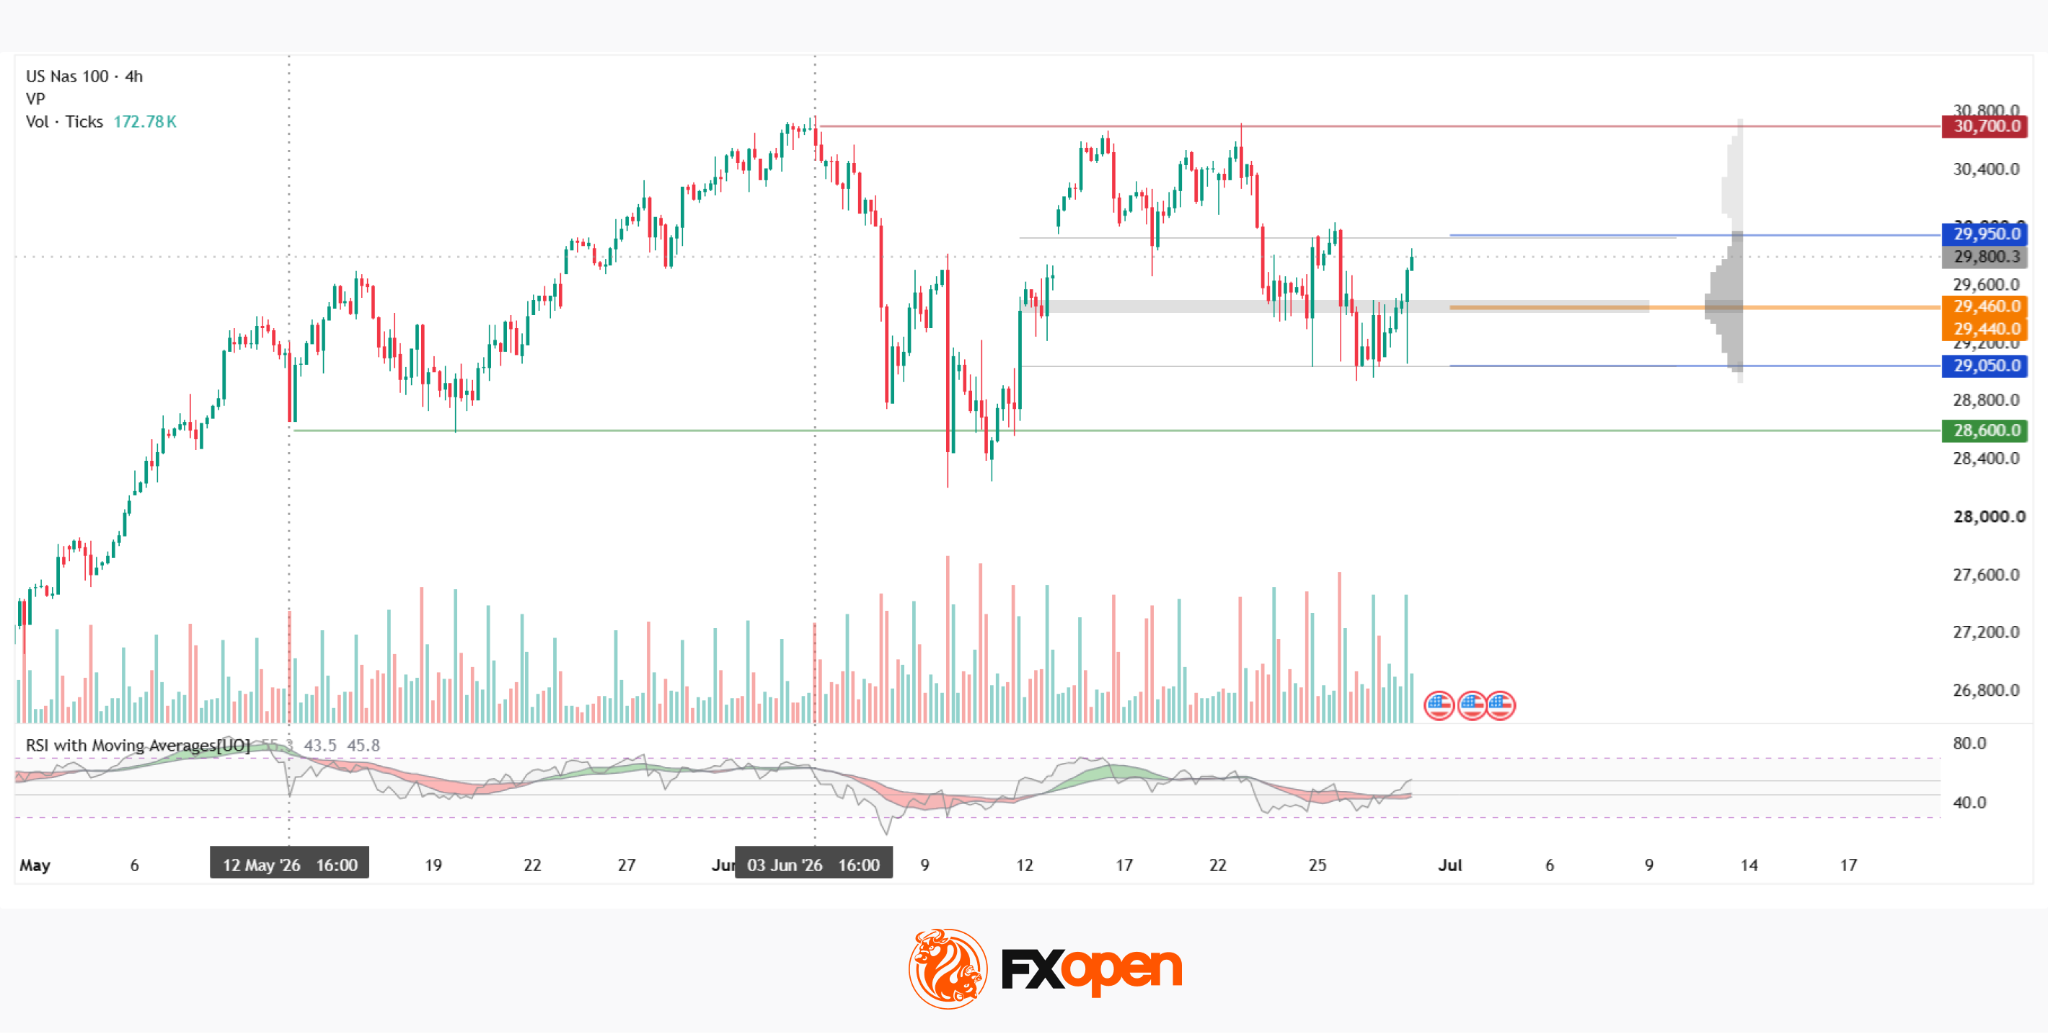
On the four-hour chart, the Nasdaq-100 (NDXm on FXOpen) has been trading within a sideways range since May, bounded by support near 28,600 and resistance around 30,700 — a range that formed following the June peak. After reaching that peak, the index experienced a sharp decline on 9 June, accompanied by exceptionally high trading volume. As a result of buyers defending the local lows, the price has since concentrated near the centre of the current range.
At present, the price is holding above the POC zone at 29,440–29,460, which may be viewed by market participants as the key point of attraction within the range. The price is approaching intermediate resistance at the upper boundary of the profile at 29,950, above which lies the red resistance level. RSI + MAs shows readings of 55, 43 and 45 — the oscillator remains above both moving averages, although the moving averages have yet to confirm a potential reversal and remain near the lower boundary of the neutral zone.
Key Takeaways
News of a pause in the US-Iran conflict supported the Nasdaq-100 at the market open, although concerns surrounding AI-related spending remain unresolved and were the primary driver of price action throughout June. The POC zone continues to serve as the key reference point for the balance between supply and demand: this is where the largest concentration of horizontal volume is located, and holding above this area could indicate that the market is preparing to continue its move towards the upper part of the range.
Trade global index CFDs with zero commission and tight spreads (additional fees may apply). Open your FXOpen account now or learn more about trading index CFDs with FXOpen.
This article represents the opinion of the Companies operating under the FXOpen brand only. It is not to be construed as an offer, solicitation, or recommendation with respect to products and services provided by the Companies operating under the FXOpen brand, nor is it to be considered financial advice.
Stay ahead of the market!
Subscribe now to our mailing list and receive the latest market news and insights delivered directly to your inbox.


Latest articles

Weekly Market Insights with Gary Thomson: The Week of Central Banks and Earnings
In this video, we’ll explore the key economic events and market trends, shaping the financial landscape. Get ready for insights into financial markets to help you navigate the week ahead. Let’s dive in!
In this episode of Market

Intel at a Crossroads: Earnings Beat Meets Technical Resistance
Intel has just delivered its strongest quarter in over fifteen years, and the market reaction says it all. Q2 2026 revenue surged 25% year-over-year to $16.1 billion, crushing the consensus estimate of $14.42 billion, while adjusted EPS of

Tesla: Complex Range Structure Breaks Down Following Quarterly Earnings
Tesla released its Q2 2026 results after the market closed on 22 July. Revenue increased 26% year-on-year to $28.24 billion, while vehicle deliveries reached a record 480,126 units. However, operating margin fell sharply to 1.4%, down from