


Tesla: Attempted Decline Following a Corrective Trend
FXOpen

The fundamental backdrop surrounding Tesla has been mixed in recent weeks. In the first quarter of 2026, the company exceeded consensus expectations, reporting adjusted EPS of $0.41 versus forecasts of $0.36, while revenue reached $22.38 billion. Gross margin in the automotive segment improved to 19.2%, and the company recorded its largest order backlog in more than two years.
At the same time, corporate developments continue to influence market sentiment. Speculation regarding a potential merger between Tesla and SpaceX has intensified following CNBC reports on 27 May that Elon Musk had discussed a combination of the two companies with colleagues. Against this backdrop, JPMorgan removed its long-standing "underweight" rating on 5 June, ending a bearish stance that had been maintained for years.
Technical Picture
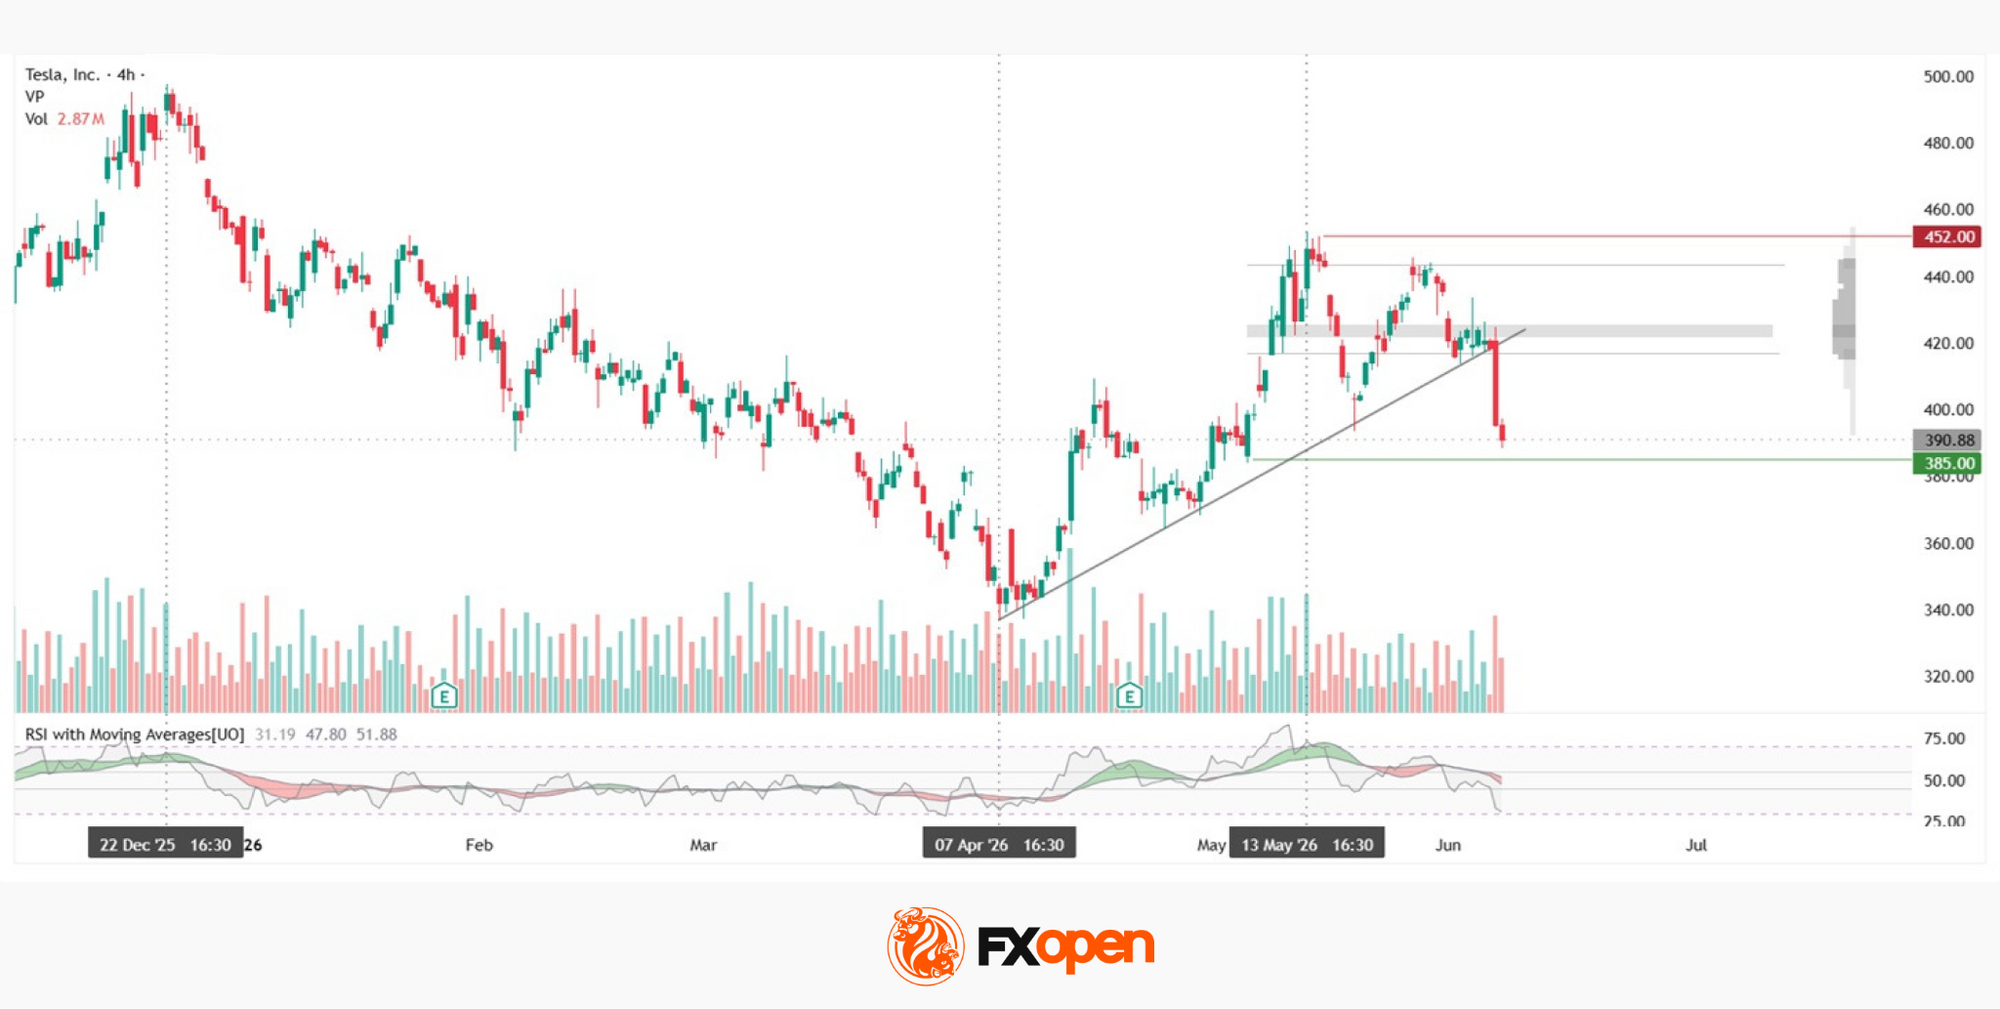
On the four-hour chart, Tesla shares display a three-phase structure. From late December 2025 through early April 2026, the stock remained in a sustained downtrend. After forming a local low near 337, the price reversed higher and entered a corrective advance. The correction peaked in the 452 area before a sharp decline brought the shares back towards current levels.
The upper boundary of the profile at 443 and the 452 area could act as resistance should a bullish scenario develop. Meanwhile, the green support level near 385 remains a potential downside target for sellers.
The point of control (POC) of the horizontal volume profile is concentrated between 423 and 424, making this area — together with the lower boundary of the profile — particularly important to monitor. The profile boundaries at 417 and 443 define the current trading range, and either a breakout or a successful defence of these levels could encourage more active participation from market participants.
The RSI and its moving averages currently stand at 31, 47 and 51. The oscillator is approaching oversold territory, while the moving averages remain close to the neutral zone, suggesting that momentum has yet to develop a clear directional bias.
Key Takeaways
The technical outlook for Tesla shares is currently centred on price action around key support levels. Until the 385 level is decisively broken and confirmed by corresponding signals from the RSI and its moving averages, neither side appears to hold a clear advantage. Meanwhile, the corporate narrative remains focused on the potential SpaceX merger and JPMorgan's rating revision, both of which could act as catalysts for the stock's next medium-term move.
Buy and sell stocks of the world's biggest publicly-listed companies with CFDs on FXOpen’s trading platform. Open your FXOpen account now or learn more about trading share CFDs with FXOpen.
This article represents the opinion of the Companies operating under the FXOpen brand only. It is not to be construed as an offer, solicitation, or recommendation with respect to products and services provided by the Companies operating under the FXOpen brand, nor is it to be considered financial advice.
Stay ahead of the market!
Subscribe now to our mailing list and receive the latest market news and insights delivered directly to your inbox.


Latest articles

CAD/JPY: The Yen's Most Historic Move in 30 Years Meets a Fragile Support
Two central banks are heading in genuinely opposite directions this week, and the tension is unmistakable. The Bank of Canada held rates steady at 2.25% on September 2, with a mildly hawkish tilt as policymakers acknowledged a broadening economic

USD/JPY and USD/CAD Await Key Fed Decision
The US dollar is consolidating against the yen and Canadian dollar ahead of the key event of the week — the Federal Reserve meeting. The Fed is widely expected to raise its policy rate by 25 basis points to a range

UnitedHealth: Fundamentals Are Healing, Now the Chart Must Agree
UnitedHealth finds itself in a genuinely split narrative right now, trading near $388, down about 15.9% from its 52-week high, even as the fundamental picture keeps improving. Q2 earnings beat expectations, with revenue of $112.03 billion, and the