


Tesla Shares: Quarterly Results Provide No Clear Direction
FXOpen

On 22 April, Tesla released its Q1 2026 results: adjusted earnings per share came in at $0.41 versus expectations of $0.37, but revenue of $22.39 billion fell short of the $22.64 billion forecast. The automotive segment continues to lose ground under pressure from competitors, particularly China’s BYD and Xiaomi. Additional concern came from the energy storage division, where deployments dropped 38% compared to the record fourth quarter of 2025 — a segment that had recently been seen as a key growth driver.
Management continues to pin its long-term growth strategy on robotaxis and autonomous driving.
Technical picture
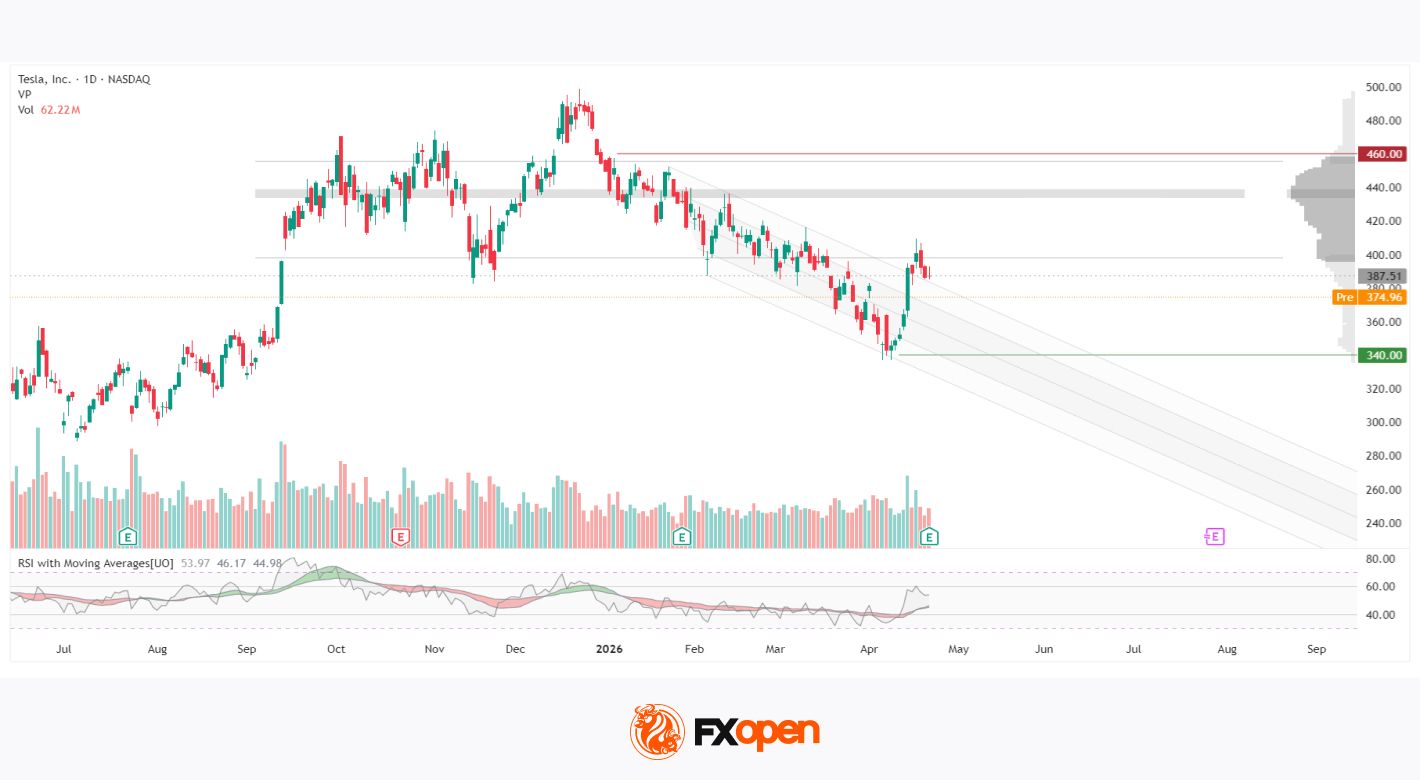
On the daily chart, TSLA appears to have been trading within a sustained downward channel since peaking near $500 in December. In early April, price reached the $340 level, which coincided with the lower boundary of the channel — and the confluence of these levels may have strengthened buyer reaction. In recent sessions, price has moved above the upper boundary of the channel, although the breakout has not yet been confirmed by a sustained close, and the earnings release has not provided a clear signal for the near-term trend. Nevertheless, the move itself remains notable.
The horizontal volume profile spans the $398–455 range, with the Point of Control concentrated around $433–440 — an area of high liquidity that may now represent the nearest resistance. The RSI with moving averages shows readings of 53 / 46 / 44: the indicator has moved above the neutral 50 level, while both moving averages remain below it, suggesting that a sustained bullish impulse has yet to be confirmed.
Summary
The earnings report delivered mixed signals to the market: the earnings beat may not have been sufficient to offset weaker revenue and a sharp decline in the energy segment. From a technical perspective, the key question is whether price can hold above the upper boundary of the channel — as an unconfirmed breakout can often fail, particularly with a dense volume zone overhead.
Buy and sell stocks of the world's biggest publicly-listed companies with CFDs on FXOpen’s trading platform. Open your FXOpen account now or learn more about trading share CFDs with FXOpen.
This article represents the opinion of the Companies operating under the FXOpen brand only. It is not to be construed as an offer, solicitation, or recommendation with respect to products and services provided by the Companies operating under the FXOpen brand, nor is it to be considered financial advice.
Stay ahead of the market!
Subscribe now to our mailing list and receive the latest market news and insights delivered directly to your inbox.


Latest articles

CAD/JPY: The Yen's Most Historic Move in 30 Years Meets a Fragile Support
Two central banks are heading in genuinely opposite directions this week, and the tension is unmistakable. The Bank of Canada held rates steady at 2.25% on September 2, with a mildly hawkish tilt as policymakers acknowledged a broadening economic

USD/JPY and USD/CAD Await Key Fed Decision
The US dollar is consolidating against the yen and Canadian dollar ahead of the key event of the week — the Federal Reserve meeting. The Fed is widely expected to raise its policy rate by 25 basis points to a range

UnitedHealth: Fundamentals Are Healing, Now the Chart Must Agree
UnitedHealth finds itself in a genuinely split narrative right now, trading near $388, down about 15.9% from its 52-week high, even as the fundamental picture keeps improving. Q2 earnings beat expectations, with revenue of $112.03 billion, and the