


USD/CHF: Consolidation After the Trend
FXOpen

Fundamental Backdrop
The Swiss franc remains influenced by two opposing forces. On the one hand, there is steady demand for safe-haven assets amid tariff-related risks stemming from the United States. On the other, the policy stance of the Swiss National Bank (SNB) continues to play a role: in March, the central bank kept its policy rate at zero and reaffirmed its readiness to intervene in the foreign exchange market to prevent excessive franc appreciation.
The Federal Reserve, for its part, is also taking a cautious approach to policy easing. In January, the Fed paused its rate-cutting cycle, citing persistent inflationary pressures. The divergence in the rhetoric of the two central banks has so far failed to provide either side with a sustained advantage.
Technical Picture
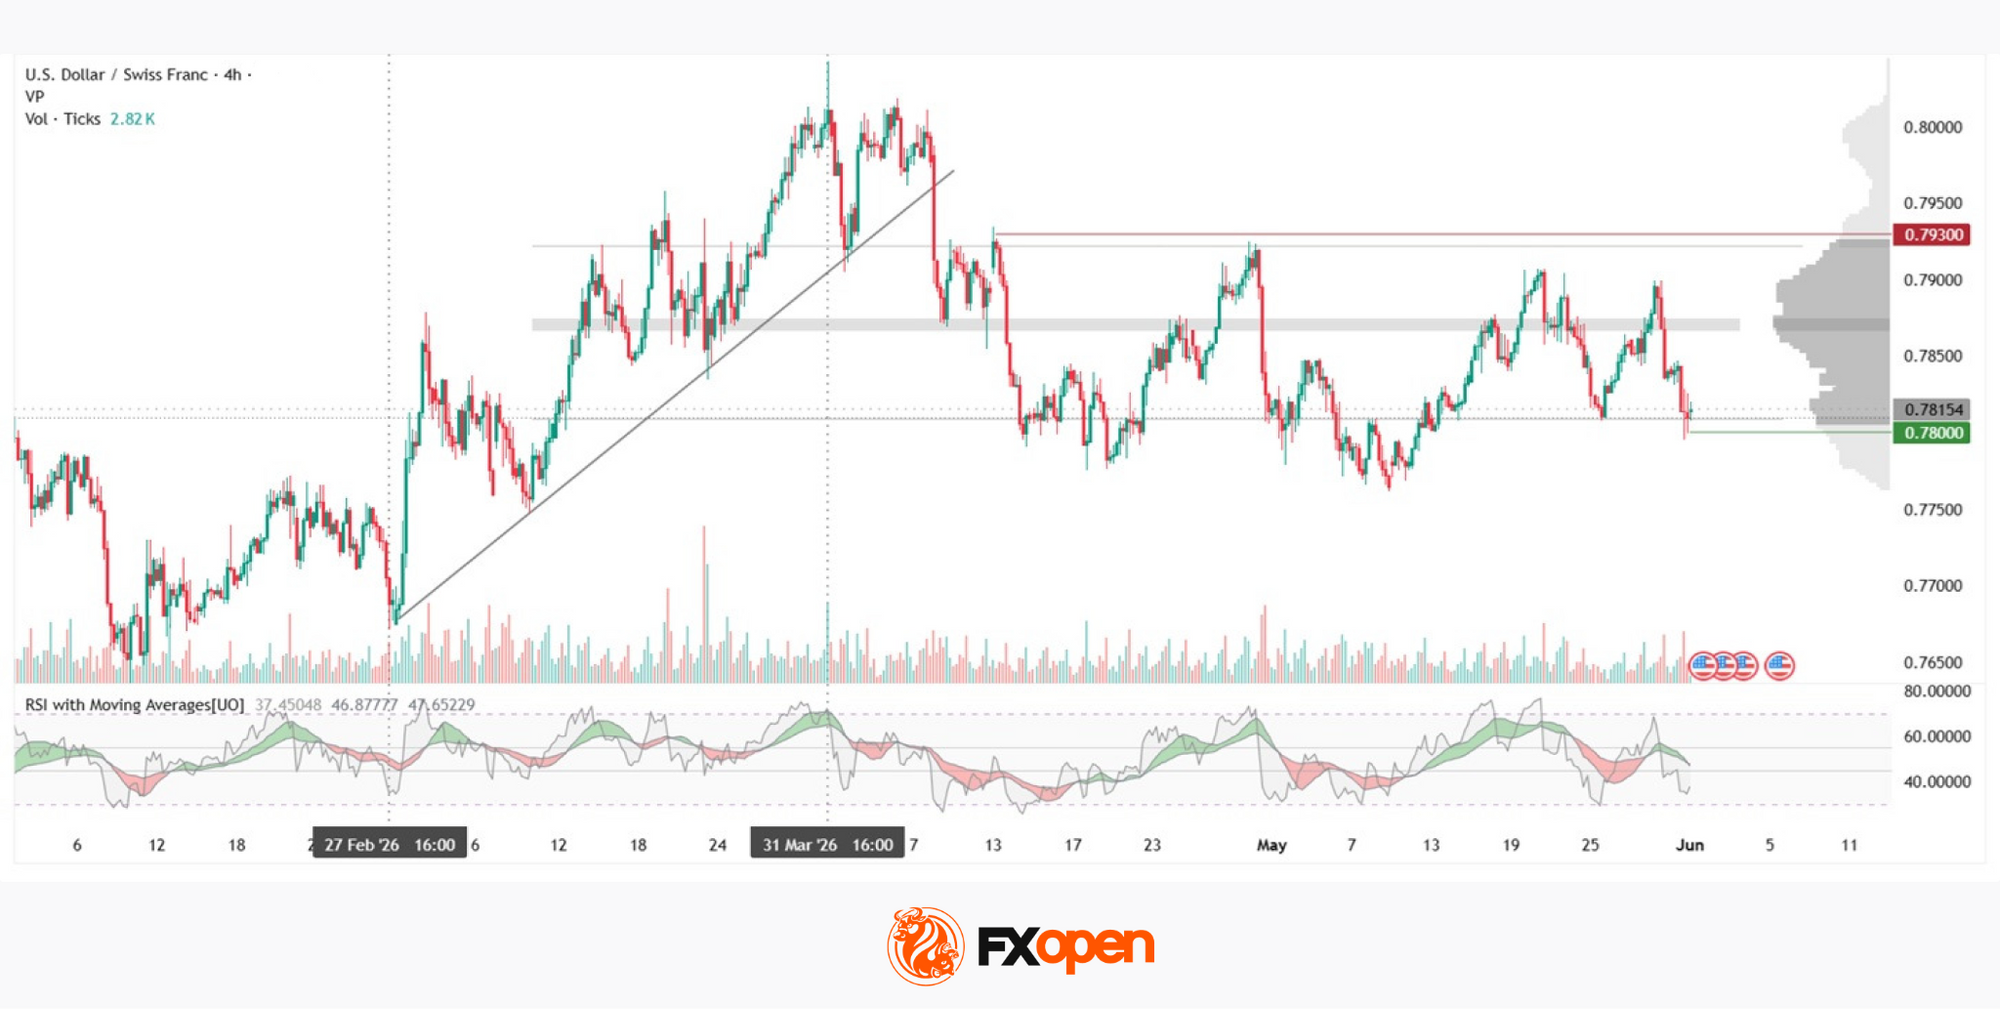
The starting point of the current structure was the 0.7600 area, where USD/CHF formed a local bottom in late January. From 27 February to 31 March, an ascending trendline developed, accompanying the pair’s rise towards the 0.8050 area. In April, the trendline was broken, after which the pair transitioned into a sideways trading phase that remains in place today. The horizontal volume profile formed during this period identifies a point of control in the 0.7865–0.7875 range, where the market spent the greatest amount of time during the period under review.
At present, the price is positioned above the lower boundary of the profile and is testing it from above. The 0.7930 area could attract market participants’ attention should the pair continue to move higher. The 0.7800 region remains a potential reference point if a bearish move develops, as it represents the nearest support zone.
The RSI oscillator and its moving averages currently show readings of 37/46/47. The indicator remains below both moving averages; however, the averages themselves are still positioned in neutral territory, which should also be taken into account.
Key Takeaways
The pair has completed its upward trend and entered a consolidation phase, while price is currently testing the lower boundary of the existing profile. The RSI and its moving averages stand at 37/46/47: the indicator remains below both moving averages, although the averages themselves are still located in neutral territory.
Trade over 50 forex markets 24 hours a day with FXOpen. Take advantage of low commissions, deep liquidity, and spreads from 0.0 pips (additional fees may apply). Open your FXOpen account now or learn more about trading forex with FXOpen.
This article represents the opinion of the Companies operating under the FXOpen brand only. It is not to be construed as an offer, solicitation, or recommendation with respect to products and services provided by the Companies operating under the FXOpen brand, nor is it to be considered financial advice.
Stay ahead of the market!
Subscribe now to our mailing list and receive the latest market news and insights delivered directly to your inbox.


Latest articles

Dow Jones (DJIA): Consolidation Beyond the Trend
Federal Reserve Chair Kevin Warsh testified before Congress on 14–15 July, reaffirming the Fed's commitment to bringing inflation back to target while providing no clear guidance on the future path of interest rates. Meanwhile, June inflation data came in

European Currencies Strengthen Ahead of Key Macroeconomic Releases
EUR/USD and GBP/USD continue to recover moderately following the recent weakening of the US dollar. European currencies have been supported by expectations that US inflationary pressures will continue to ease after softer-than-expected CPI and PPI data, reinforcing market

Brent Crude Oil: From Ceasefire to Crossfire — What's Next?
Just weeks ago, traders were pricing in peace. Now they're pricing in war again—and that reversal says everything about how fragile the current Middle East calm really is.
Brent crude has surged to $86 a barrel, its highest level