


WTI: Falling Production and Deadlock in Negotiations
FXOpen

Fundamental Background
As a result of the military conflict between the United States and Iran, the combined volume of halted oil production in Iraq, Saudi Arabia, Kuwait, the UAE, Qatar and Bahrain reached 10.5 million barrels per day in April, triggering record declines in global oil inventories. The U.S. Energy Information Administration forecasts a drop in global inventories of 8.5 million barrels per day in the second quarter of 2026 before supplies through the strait begin to recover.
An additional structural factor came from the UAE’s withdrawal from OPEC, which took effect on 1 May 2026 and reduced the cartel’s available spare production capacity. On the diplomatic front, negotiations continue without clear progress: according to available reports, Iran is prepared to accept a long-term nuclear freeze, but not the full dismantling of its nuclear programme, while both sides continue discussing conditions through intermediaries.
Technical Picture
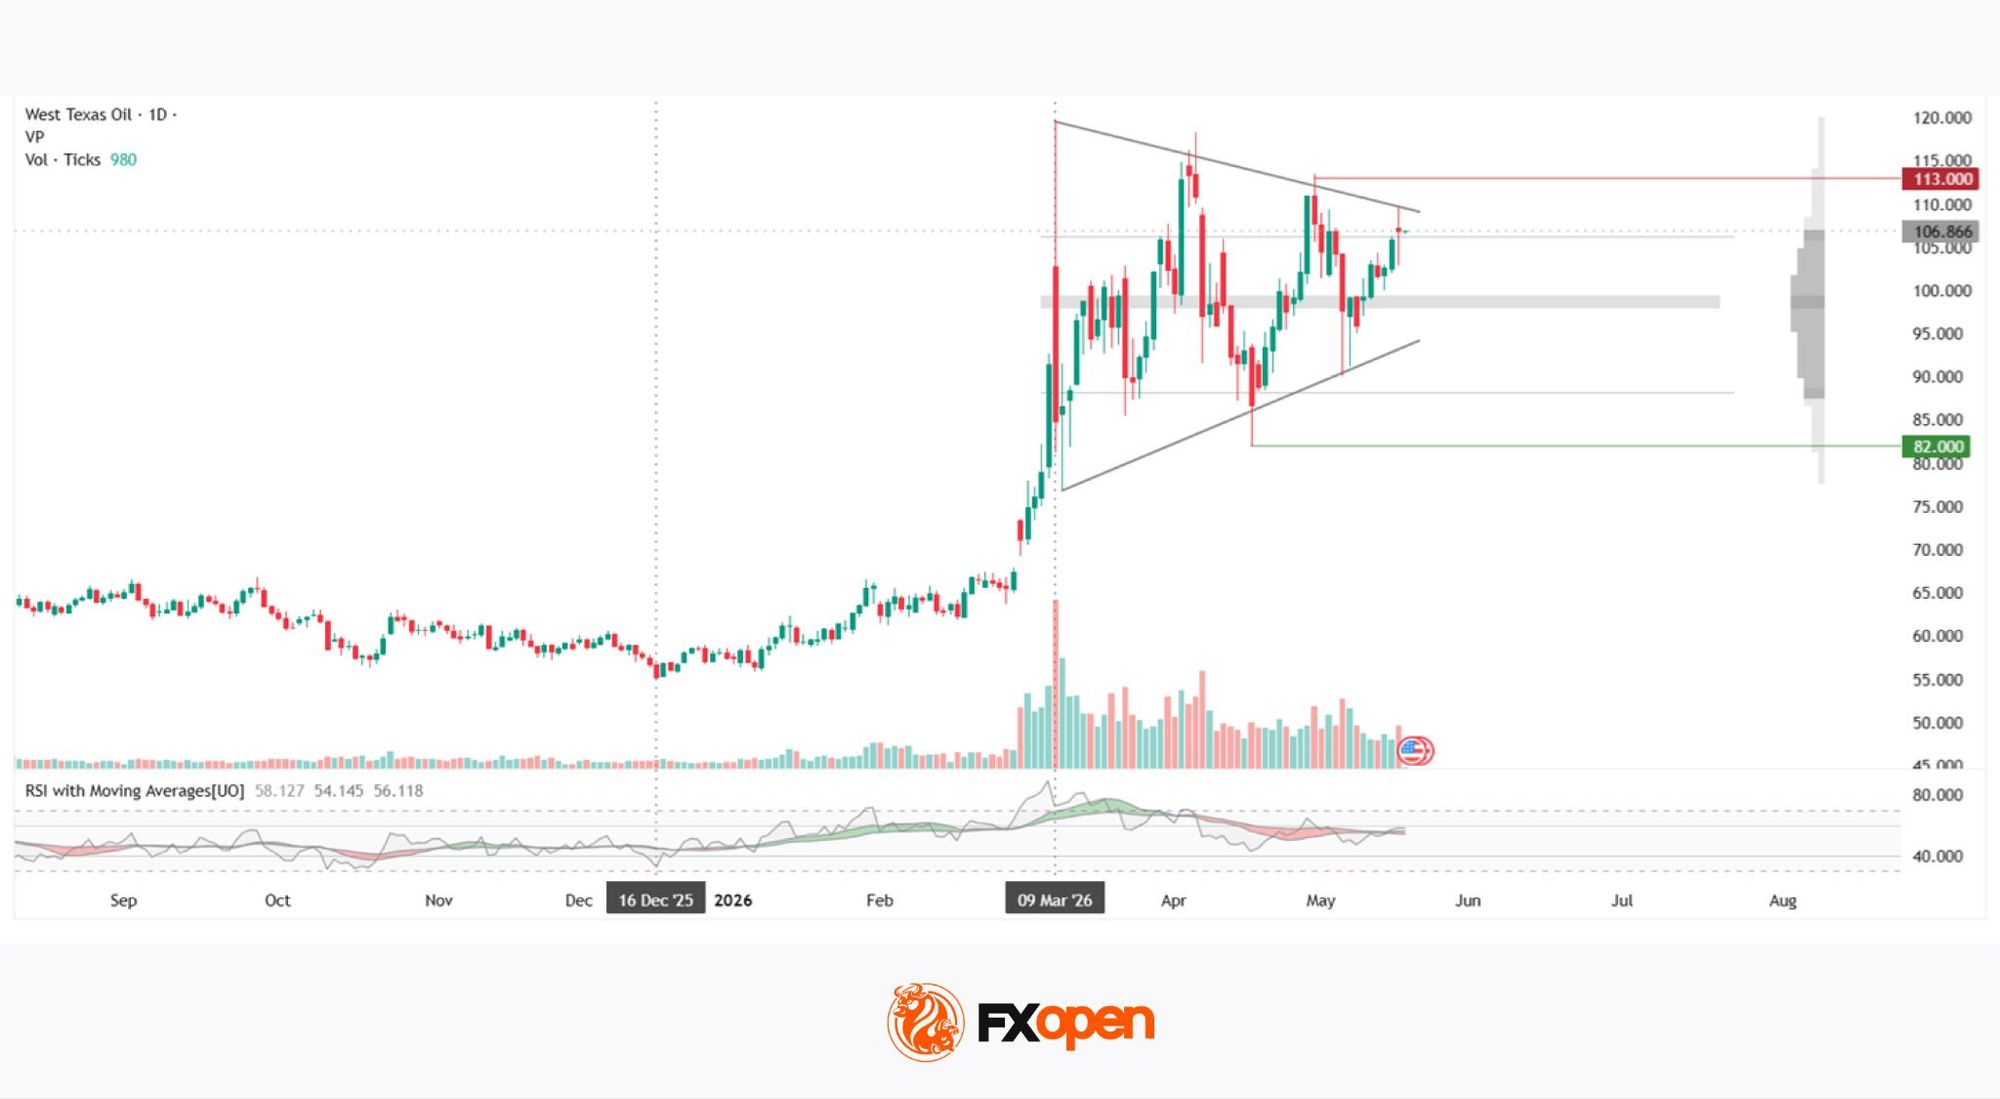
Since the sharp acceleration recorded on 9 March 2026 amid a peak surge in vertical volume, WTI crude has formed a symmetrical contracting triangle on the daily timeframe. The upper boundary of the pattern extends from the March high near 120 and continues to be actively tested by price action. The triangle boundaries are gradually converging, creating conditions for a future impulsive breakout from the formation.
At present, the price is testing the upper boundary of the triangle above the upper edge of the profile. The market volume profile covers the 88–106 range.
The point of control (POC) could be located within the 98–99.5 range and may remain the main obstacle for sellers. Current vertical trading volume remains moderate and continues to decline relative to the March peaks. The nearest resistance level is likely to stand at 113, while the key support level may be located at 82.
The RSI + MAs indicator shows readings of 58, 54 and 56 — all readings remain above the neutral 50 level, although without a strong directional impulse. All three lines are clustered together, with neither buyers nor sellers holding a clear advantage.
Key Takeaways
The current price structure is shaped by a balance between the risk premium linked to potential supply disruptions through the strait and uncertainty surrounding the timing of supply restoration. The flat RSI dynamics and the fact that price remains trapped within the triangle continue to support a wait-and-see market stance.
Start trading commodity CFDs with tight spreads (additional fees may apply). Open your trading account now or learn more about trading commodity CFDs with FXOpen.
This article represents the opinion of the Companies operating under the FXOpen brand only. It is not to be construed as an offer, solicitation, or recommendation with respect to products and services provided by the Companies operating under the FXOpen brand, nor is it to be considered financial advice.
Stay ahead of the market!
Subscribe now to our mailing list and receive the latest market news and insights delivered directly to your inbox.


Latest articles

Pound Weakens After Soft UK Inflation Data as Euro Awaits Fresh Market Signals
The pound remains under pressure following the release of weaker-than-expected UK inflation data. The slowdown in inflation has strengthened expectations that the Bank of England could adopt a more accommodative policy stance in the coming months, weighing on sterling. Meanwhile,

Alphabet: Record Profit as Markets Await Their Verdict
On 22 July, Alphabet reported its Q2 2026 results, with revenue rising 24% year-on-year to $119.8 billion. Google Cloud revenue surged 82% to $24.77 billion, comfortably exceeding analysts' expectations. Search advertising generated $63.3 billion in revenue (+17%

NZD/USD Analysis: A Tug-of-War at the Critical Level
The kiwi has strengthened meaningfully against most peers this month. However, against the US dollar specifically, NZD/USD remains well below its 2026 highs, trading in the mid-0.58 area versus January's peak near 0.6075.
New Zealand's Q2 inflation