


Brent Crude Oil: From Ceasefire to Crossfire — What's Next?
FXOpen

Just weeks ago, traders were pricing in peace. Now they're pricing in war again—and that reversal says everything about how fragile the current Middle East calm really is.
Brent crude has surged to $86 a barrel, its highest level in a month, after the Washington-Tehran ceasefire effectively collapsed. US strikes hit Iranian defence infrastructure, Iranian missiles struck Emirati tankers, and Washington reinstated its naval blockade of Iranian ports.
Additionally, yesterday's June CPI year-on-year print eased bullish pressure on the dollar and gave a lift to dollar-denominated assets. Headline inflation fell to 3.5% year-on-year, well below the expected 3.8%, largely thanks to a sharp drop in energy prices during June. However, the read looks backward-looking rather than structural: it reflects June's energy weakness, before the ceasefire unraveled.
Technical Analysis of Brent Crude Oil
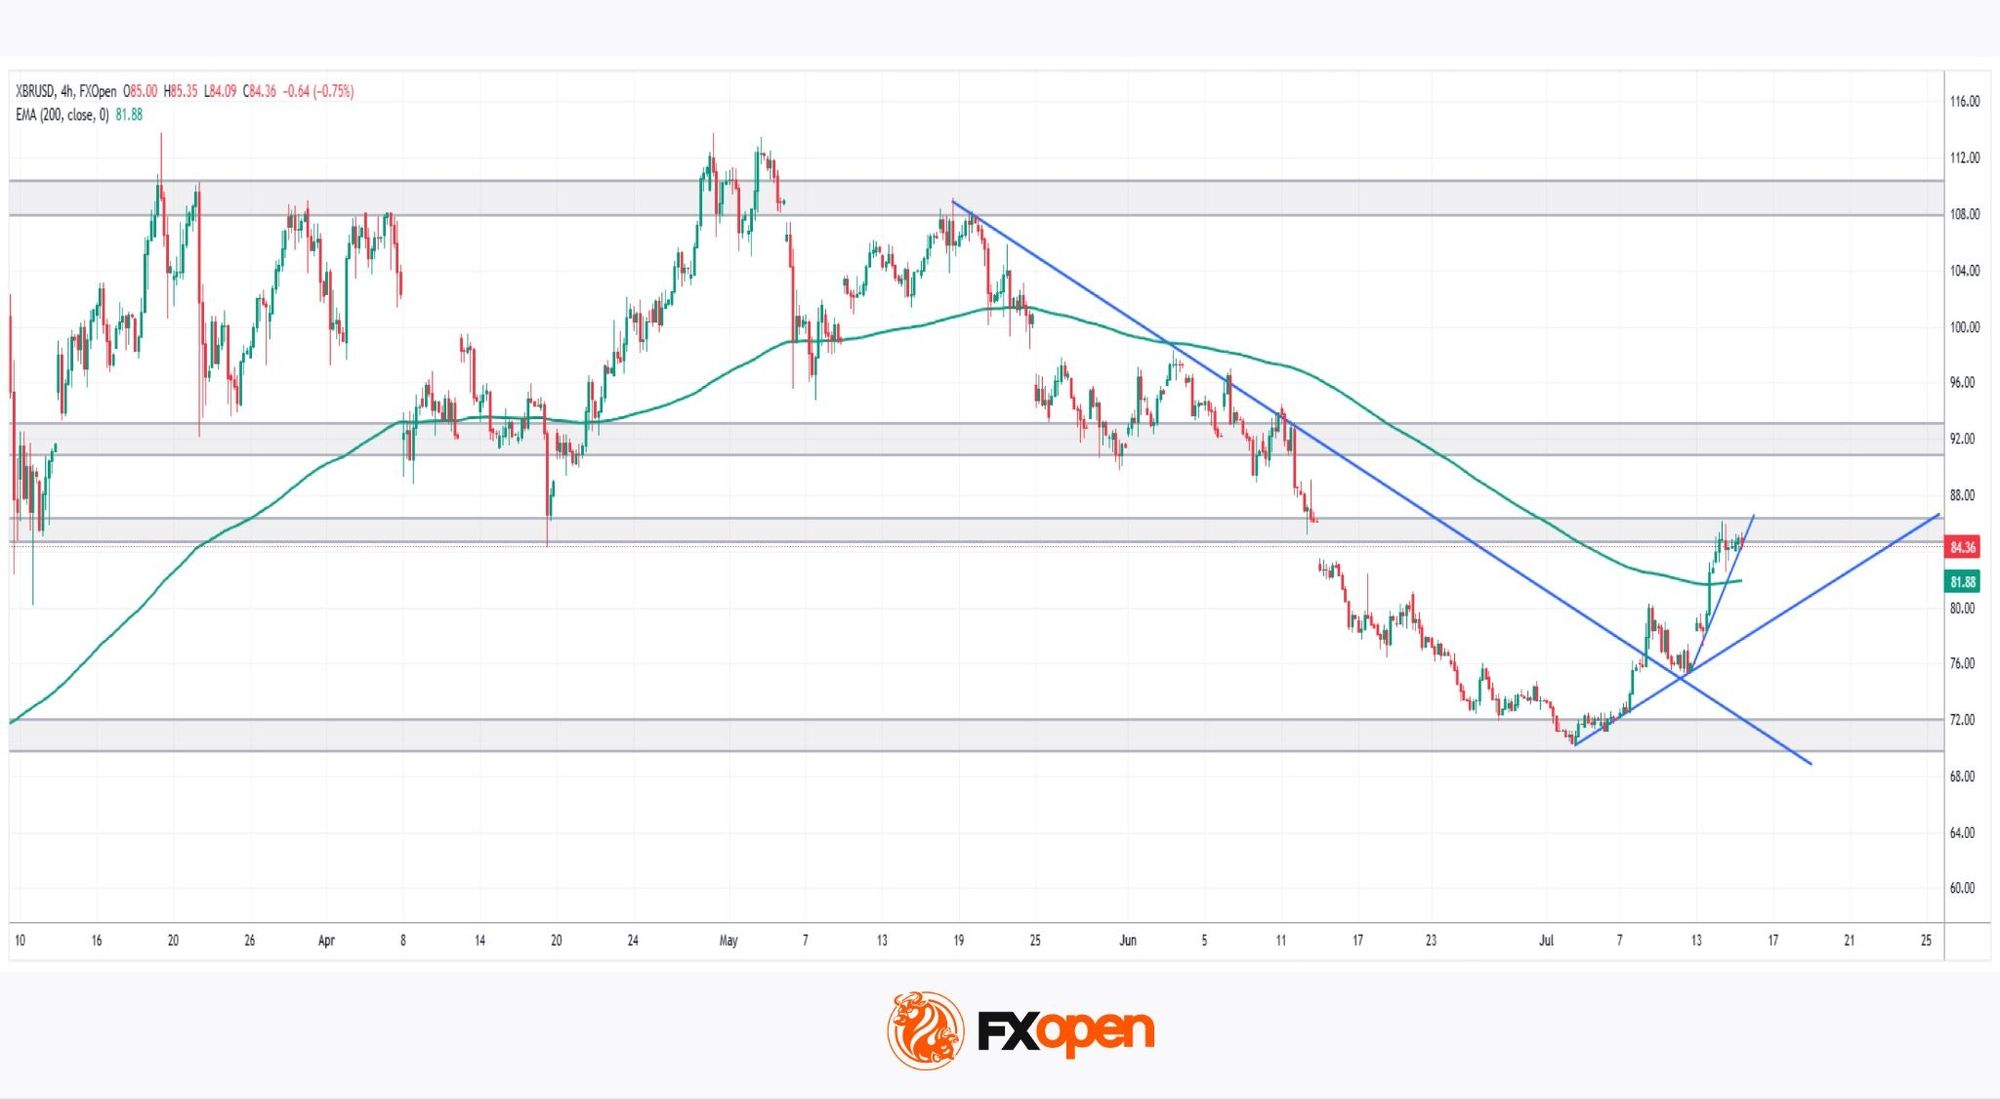
As the chart shows, Brent entered a clear downtrend after being repeatedly rejected from the psychological $110 zone in May, marked by lower highs and lower lows and a descending trendline respected for nearly two months.
Bullish Scenario
After bottoming near $70 in early July, Brent shifted character, printing higher highs and higher lows due to renewed Middle East tensions. This was confirmed by a break and retest of the descending trendline, followed by a reclaim and retest of the 200-period EMA. With two ascending trendlines now supporting the move, price sits at a key juncture: the $85 zone, a former support turned resistance. A confirmed break here would open the path back toward the $90-$92 zone.
Bearish Scenario
Alternatively, Brent could reject $85 once again, pulling the price back into the $70–$80 range that has defined the past month. Confirmation would come from a break below both the short-term trendline and the 200-period EMA, signaling that buyers have lost control and exposing the range lows.
Brent Crude now sits at a genuine crossroads, caught between an unresolved geopolitical crisis and a technical structure hinting at renewed strength. Whether this bounce marks a real turning point or just another head-fake within a volatile range will likely hinge on who blinks first—Washington and Tehran, or buyers and sellers at $85. Either way, the next move could set the tone for the entire energy market this summer.
Start trading commodity CFDs with tight spreads (additional fees may apply). Open your trading account now or learn more about trading commodity CFDs with FXOpen.
This article represents the opinion of the Companies operating under the FXOpen brand only. It is not to be construed as an offer, solicitation, or recommendation with respect to products and services provided by the Companies operating under the FXOpen brand, nor is it to be considered financial advice.
Stay ahead of the market!
Subscribe now to our mailing list and receive the latest market news and insights delivered directly to your inbox.


Latest articles

CAD/JPY: The Yen's Most Historic Move in 30 Years Meets a Fragile Support
Two central banks are heading in genuinely opposite directions this week, and the tension is unmistakable. The Bank of Canada held rates steady at 2.25% on September 2, with a mildly hawkish tilt as policymakers acknowledged a broadening economic

USD/JPY and USD/CAD Await Key Fed Decision
The US dollar is consolidating against the yen and Canadian dollar ahead of the key event of the week — the Federal Reserve meeting. The Fed is widely expected to raise its policy rate by 25 basis points to a range

UnitedHealth: Fundamentals Are Healing, Now the Chart Must Agree
UnitedHealth finds itself in a genuinely split narrative right now, trading near $388, down about 15.9% from its 52-week high, even as the fundamental picture keeps improving. Q2 earnings beat expectations, with revenue of $112.03 billion, and the