


US Dollar Index Analysis: Dollar at a Crucial Point, What's Next?
FXOpen

As the chart shows, the US Dollar Index (DXY) has gained more than 4% from its January lows, with the move accelerating from February 2026 onwards. Today, the dollar finds itself at a technically and fundamentally critical point, one that could define the near-term direction not only of the greenback itself, but of equity indices, dollar-paired currencies, commodities, and cryptocurrencies alike.
What Has Been Driving Dollar Strength?
The primary driver behind the dollar's recent appreciation has been geopolitical uncertainty in the Middle East, with the US dollar and crude oil (XBR/USD and WTI/USD) being the natural beneficiaries.
The most recent example came on 11 June, when President Trump stated his intention to bomb Iran and seize its oil resources — echoing the approach taken with Venezuela. Within hours, however, the statement was walked back, with officials indicating that negotiations were in their final stages. The dollar initially surged on hawkish rhetoric, then surrendered the entire gain as tensions appeared to ease, with traders reducing so-called safe-haven exposure. Should Middle East tensions escalate further and a near-term agreement fail to materialise, the dollar could find renewed buying interest and potentially challenge the key level it currently faces.
Technical Analysis of the DXY
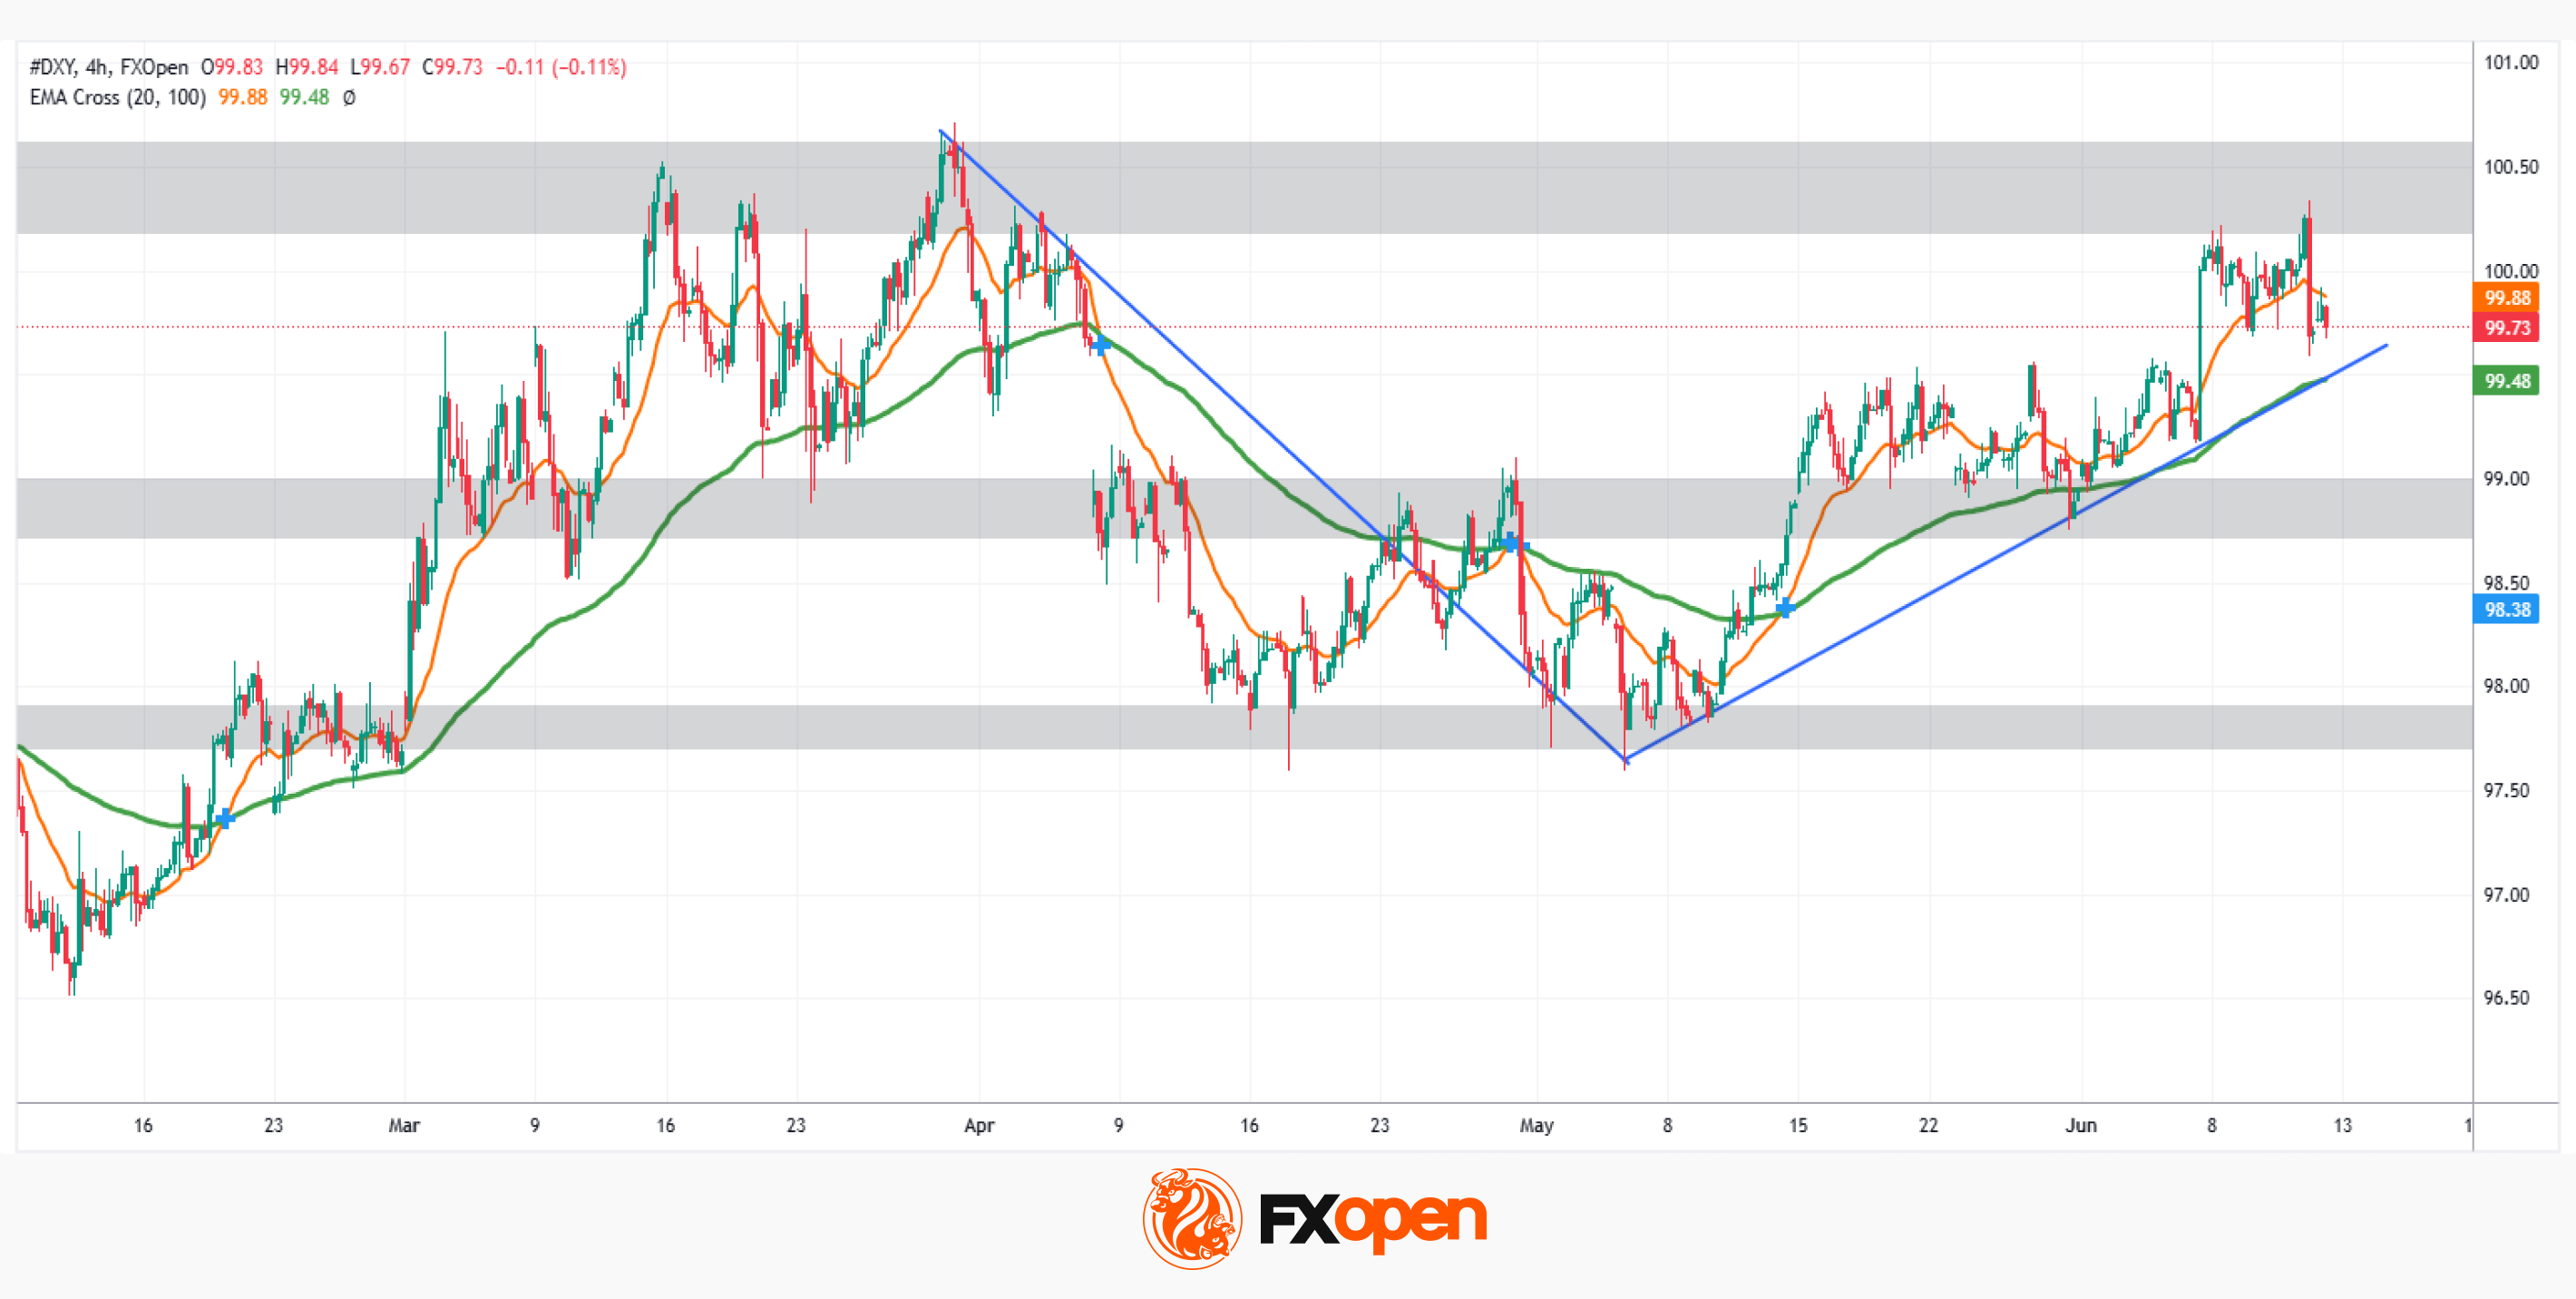
From a technical standpoint, the DXY is trading around the 100.00 level, a zone that carries both psychological and structural significance. Historically, this area acted as a major support; it now functions as a key resistance. The index has tested and rejected this zone on multiple occasions — in March, April, and again in recent sessions — yet the broader bullish structure remains intact.
On the bullish side, the immediate levels to consider are 100.31, yesterday's high, and 100.64, the 2026 high. A decisive break above these levels could open the door towards 102.00 and 103.50, where the next significant resistance areas sit.
On the bearish side, a rejection at current levels followed by a break of the ascending trendline, which has acted as reliable support for approximately two months, would also coincide with a break of the 100-period EMA, a level the DXY has historically respected. The key area to monitor in this scenario is the 98.90–98.70 zone: a confirmed break below this support could trigger a structural shift, forming lower lows and potentially opening the door to a broader bearish phase.
The dollar is walking a tightrope. Highly sensitive to both geopolitical headlines and macroeconomic data, the question remains: will the DXY finally clear the 100.00 threshold or continue to stall beneath it?
Trade global index CFDs with zero commission and tight spreads (additional fees may apply). Open your FXOpen account now or learn more about trading index CFDs with FXOpen.
This article represents the opinion of the Companies operating under the FXOpen brand only. It is not to be construed as an offer, solicitation, or recommendation with respect to products and services provided by the Companies operating under the FXOpen brand, nor is it to be considered financial advice.
Stay ahead of the market!
Subscribe now to our mailing list and receive the latest market news and insights delivered directly to your inbox.


Latest articles

Weekly Market Insights with Gary Thomson: The Week of Central Banks and Earnings
In this video, we’ll explore the key economic events and market trends, shaping the financial landscape. Get ready for insights into financial markets to help you navigate the week ahead. Let’s dive in!
In this episode of Market

Intel at a Crossroads: Earnings Beat Meets Technical Resistance
Intel has just delivered its strongest quarter in over fifteen years, and the market reaction says it all. Q2 2026 revenue surged 25% year-over-year to $16.1 billion, crushing the consensus estimate of $14.42 billion, while adjusted EPS of

Tesla: Complex Range Structure Breaks Down Following Quarterly Earnings
Tesla released its Q2 2026 results after the market closed on 22 July. Revenue increased 26% year-on-year to $28.24 billion, while vehicle deliveries reached a record 480,126 units. However, operating margin fell sharply to 1.4%, down from