


FXOpen

AUD/USD started a decent increase in Oct 2022 and climbed above 0.6500. Similarly, NZD/USD was able to clear the 0.6000 resistance zone.
Important Takeaways for AUD/USD and NZD/USD
· The Aussie Dollar gained pace above the 0.6400 and 0.6500 levels against the US Dollar.
· There is a crucial bearish trend line forming with resistance near 0.6840 on the daily chart of AUD/USD.
· NZD/USD also started a steady increase above the 0.6000 and 0.6200 levels.
· There was a clear move above a key bearish trend line with resistance near 0.6270 on the daily chart.
AUD/USD Technical Analysis
In Oct 2022, the Aussie Dollar found support near 0.6200 zone against the US Dollar. The AUD/USD pair remained well bid and started a fresh increase above the 0.6400 resistance zone.
The pair climbed higher steadily above the 0.6500 level, but it remained below the 50-day simple moving average. There was a clear move above the 50% Fibonacci retracement level of the last major decline from the 0.7145 high to 0.6170 swing low.
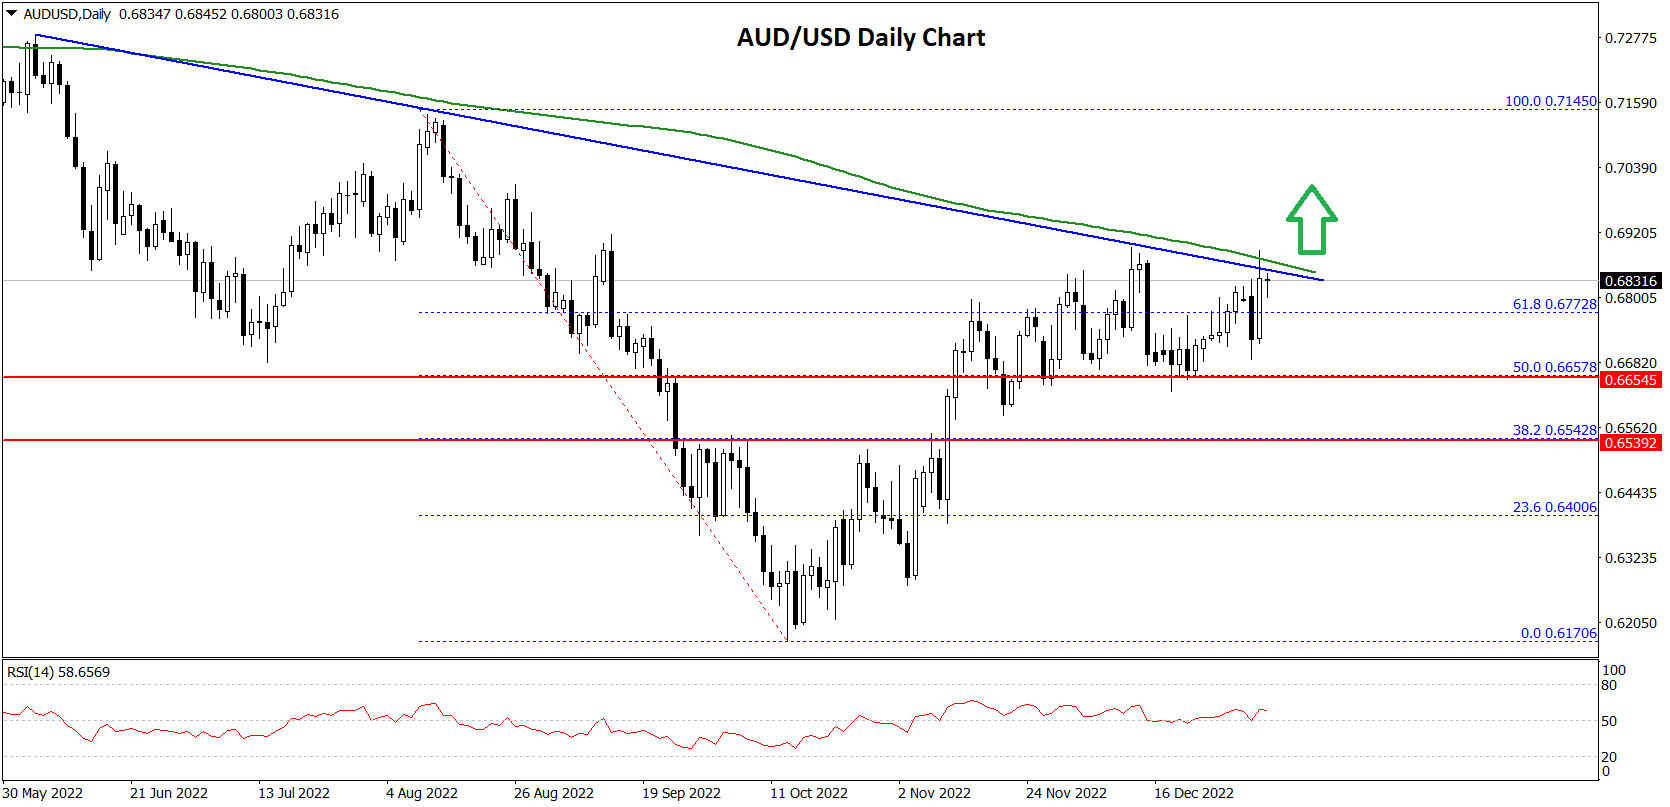
However, there are many resistances forming on the upside near the 0.6830 and 0.6850 levels. More importantly, the 50-day simple moving average is positioned near the 0.6850 level.
There is also a crucial bearish trend line forming with resistance near 0.6840 on the daily chart of AUD/USD. Only a successful daily close above 0.6850 might start a strong recovery towards the 0.7150 level.
The 76.4% Fibonacci retracement level of the last major decline from the 0.7145 high to 0.6170 swing low is also near the 0.7150 level. Any more gains might send the pair towards the 0.7200 level.
On the downside, the key supports are 0.6720 and 0.6680, below which the pair may perhaps decline extend its decline towards the 0.6600 and 0.6550 levels. Any more losses might call for a move towards the 0.6400 level.
NZD/USD Technical Analysis
The New Zealand Dollar found a strong support near the 0.5500 zone against the US Dollar. The NZD/USD pair formed a base and started a steady increase above the 0.5800 resistance.
There was a break above the 0.6000 pivot level and the 50-day simple moving average. There was a clear move above a key bearish trend line with resistance near 0.6270 on the daily chart. A new multi-month high was formed near 0.6513 and is currently correcting lower.
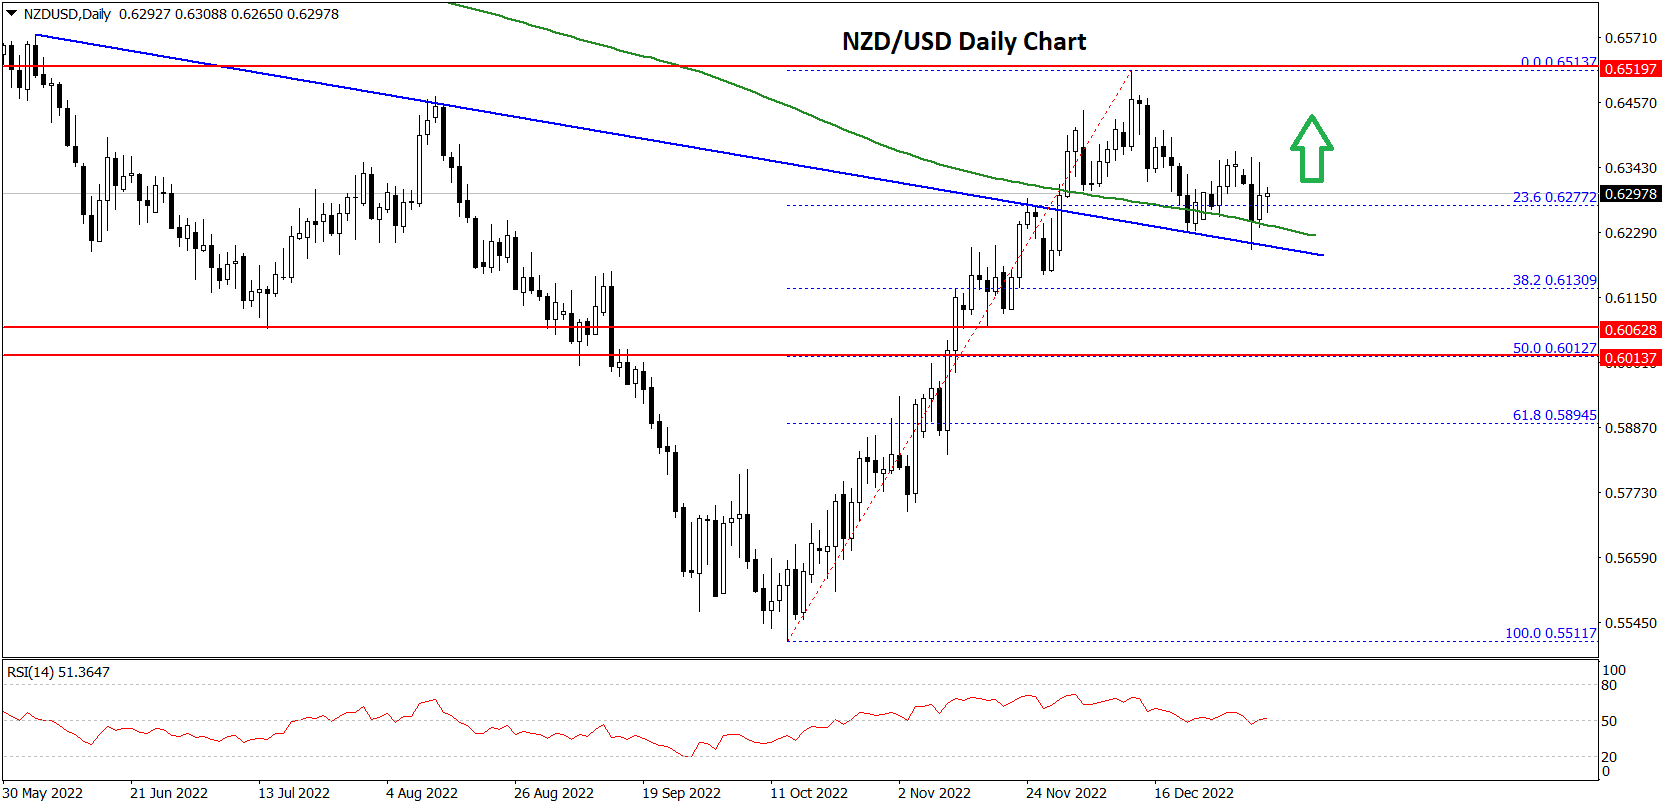
There was a move below the 0.6400 level. The pair declined below the 23.6% Fibonacci retracement level of the upward move from the 0.5511 swing low to 0.6513 high.
However, the bulls are protecting the broken trend line at 0.6200. An immediate resistance on the upside is near the 0.6450 level. The first major resistance on the upside is near the 0.6500 level.
A successful close above 0.6500 could start a solid upward move towards the 0.6700 resistance. Any more gains might send the pair towards the 0.6800 level.
On the downside, the 0.6220 level is a decent support, below which NZD/USD might decline towards the 0.6150 and 0.6100 support levels. The main support sits near the 0.6000 level. Any more losses could open the doors for a drop towards the 0.5800 level.
This forecast represents FXOpen Companies opinion only, it should not be construed as an offer, invitation or recommendation in respect to FXOpen Companies products and services or as financial advice.
Trade over 50 forex markets 24 hours a day with FXOpen. Take advantage of low commissions, deep liquidity, and spreads from 0.0 pips (additional fees may apply). Open your FXOpen account now or learn more about trading forex with FXOpen.
This article represents the opinion of the Companies operating under the FXOpen brand only. It is not to be construed as an offer, solicitation, or recommendation with respect to products and services provided by the Companies operating under the FXOpen brand, nor is it to be considered financial advice.
Stay ahead of the market!
Subscribe now to our mailing list and receive the latest market news and insights delivered directly to your inbox.


Latest articles

Consolidation Ahead of NFP: Commodity Currencies Search for Direction
Commodity-linked currencies have entered a consolidation phase following recent directional moves, as market participants adopt a wait-and-see approach ahead of key US labour market data. Current price action reflects a balance between ongoing demand for the US dollar and attempts

The Real Driver Behind the Dollar Rally: Market Insights with Gary Thomson
The US dollar has been firm, but the drivers behind the move may be more complex than they first appear.
While geopolitical tension and shifts in risk sentiment play a role, current price behaviour seems increasingly influenced by inflation expectations

EUR/USD and USD/CHF Pull Back: Market Reacts to Fundamentals
European currencies have shown a recovery in recent trading sessions after their recent decline, displaying early signs of a reversal. The US dollar is weakening amid expectations surrounding upcoming US macroeconomic data, while market participants are reassessing their short-term positions