


AUD/USD and NZD/USD Approaching Crucial Resistance
FXOpen
AUD/USD fell significantly and declined below the 0.6800 support, but later recovered nicely above 0.6940. NZD/USD also declined heavily before buyers appeared near the 0.6580 support.
Important Takeaways for AUD/USD and NZD/USD
- The Aussie Dollar fell heavily below 0.6900 and 0.6800 before buyers appeared near 0.6740 against the US Dollar.
- There was a break above a key bearish trend line with resistance at 0.6955 on the hourly chart of AUD/USD.
- NZD/USD tested the 0.6580 support area and later bounced back above 0.6610.
- There is a major bearish trend line formed with resistance at 0.6710 on the hourly chart.
AUD/USD Technical Analysis
The new year opening was super bullish for the US Dollar, resulting in a sharp decline below the 0.7000 support in the Aussie Dollar against the US Dollar. The AUD/USD pair declined below the 0.6900 and 0.6800 support levels.
The pair even broke the 0.6750 support and settled below the 50 hourly simple moving average. A low was formed at 0.6733 on FXOpen and later the pair started a solid upward move.
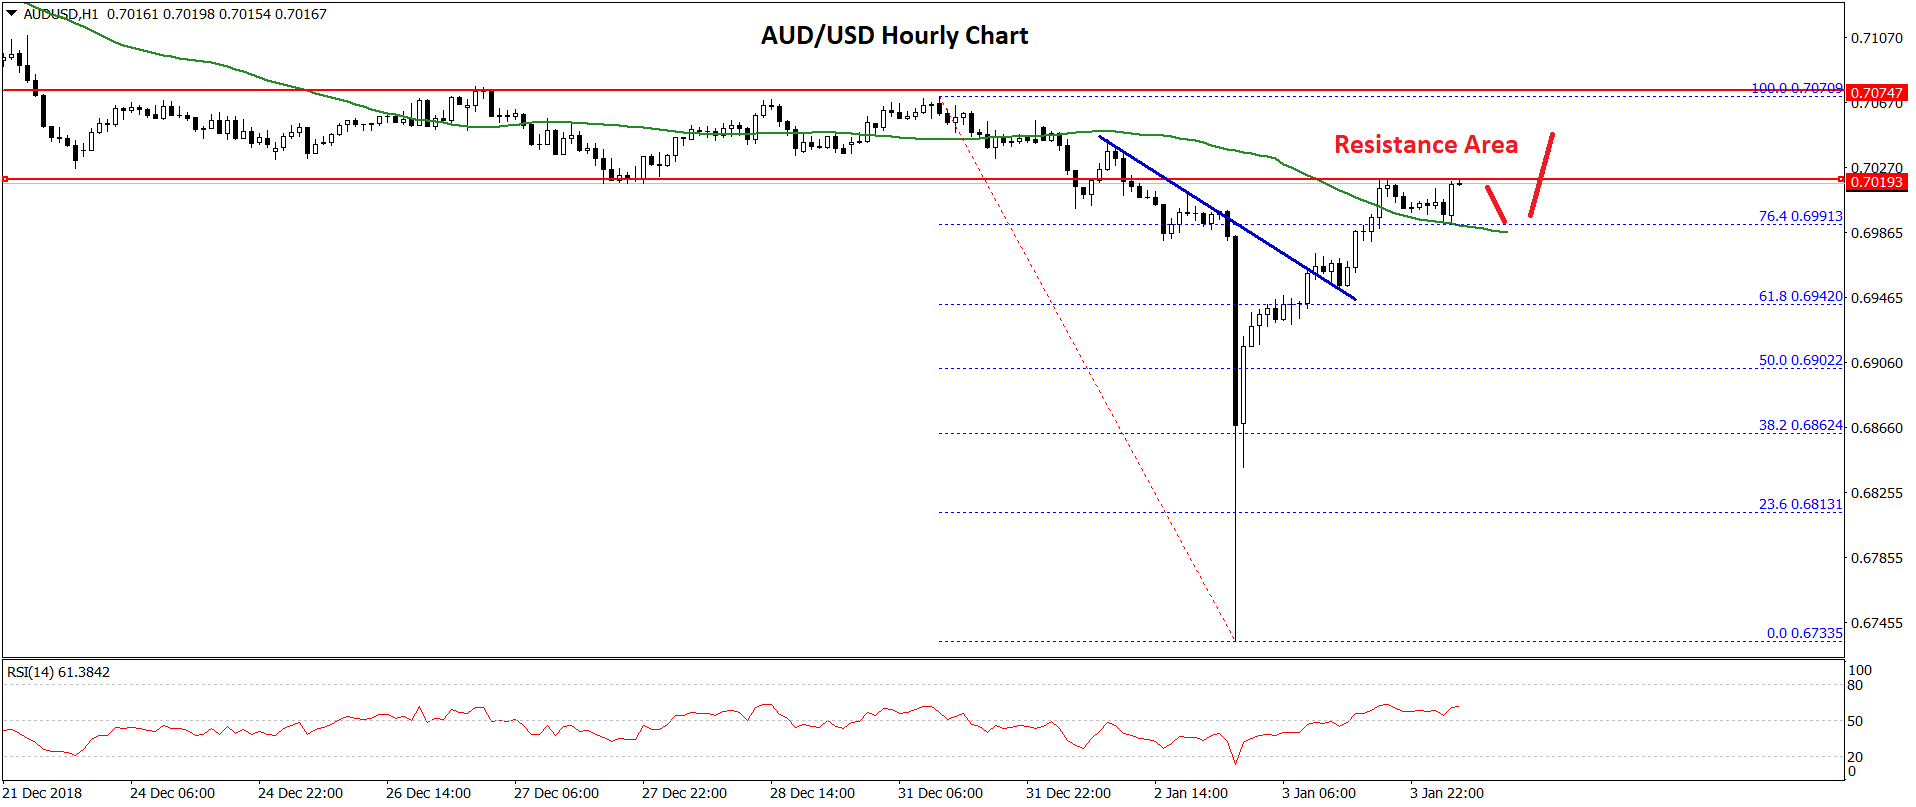
Buyers pushed the price above the 0.6800 and 0.6900 resistance levels. There was also a break above the 50% Fib retracement level of the recent decline from the 0.7070 high to 0.6733 low.
Besides, there was a break above a key bearish trend line with resistance at 0.6955 on the hourly chart of AUD/USD. The recovery was strong as there was a break above the 0.6950 resistance and the 61.8% Fib retracement level of the recent decline from the 0.7070 high to 0.6733 low.
Should there be a proper close above the 0.7000 and 0.7025 resistance levels, there could be more gains towards the 0.7070 level.
On the downside, an initial support is near the 0.6900 level, below which the pair may move back in a bearish zone towards the 0.6850 and 0.6820 support levels in the near term.
NZD/USD Technical Analysis
The New Zealand Dollar also declined sharply and broke the 0.6700 and 0.6650 support levels against the US Dollar. The NZD/USD pair even cleared the 0.6600 support and settled below the 50 hourly simple moving average.
A low was formed at 0.6585 and later the pair recovered sharply. It broke the 0.6640 resistance and the 50% Fib retracement level of the recent decline from the 0.6724 high to 0.6585 low.
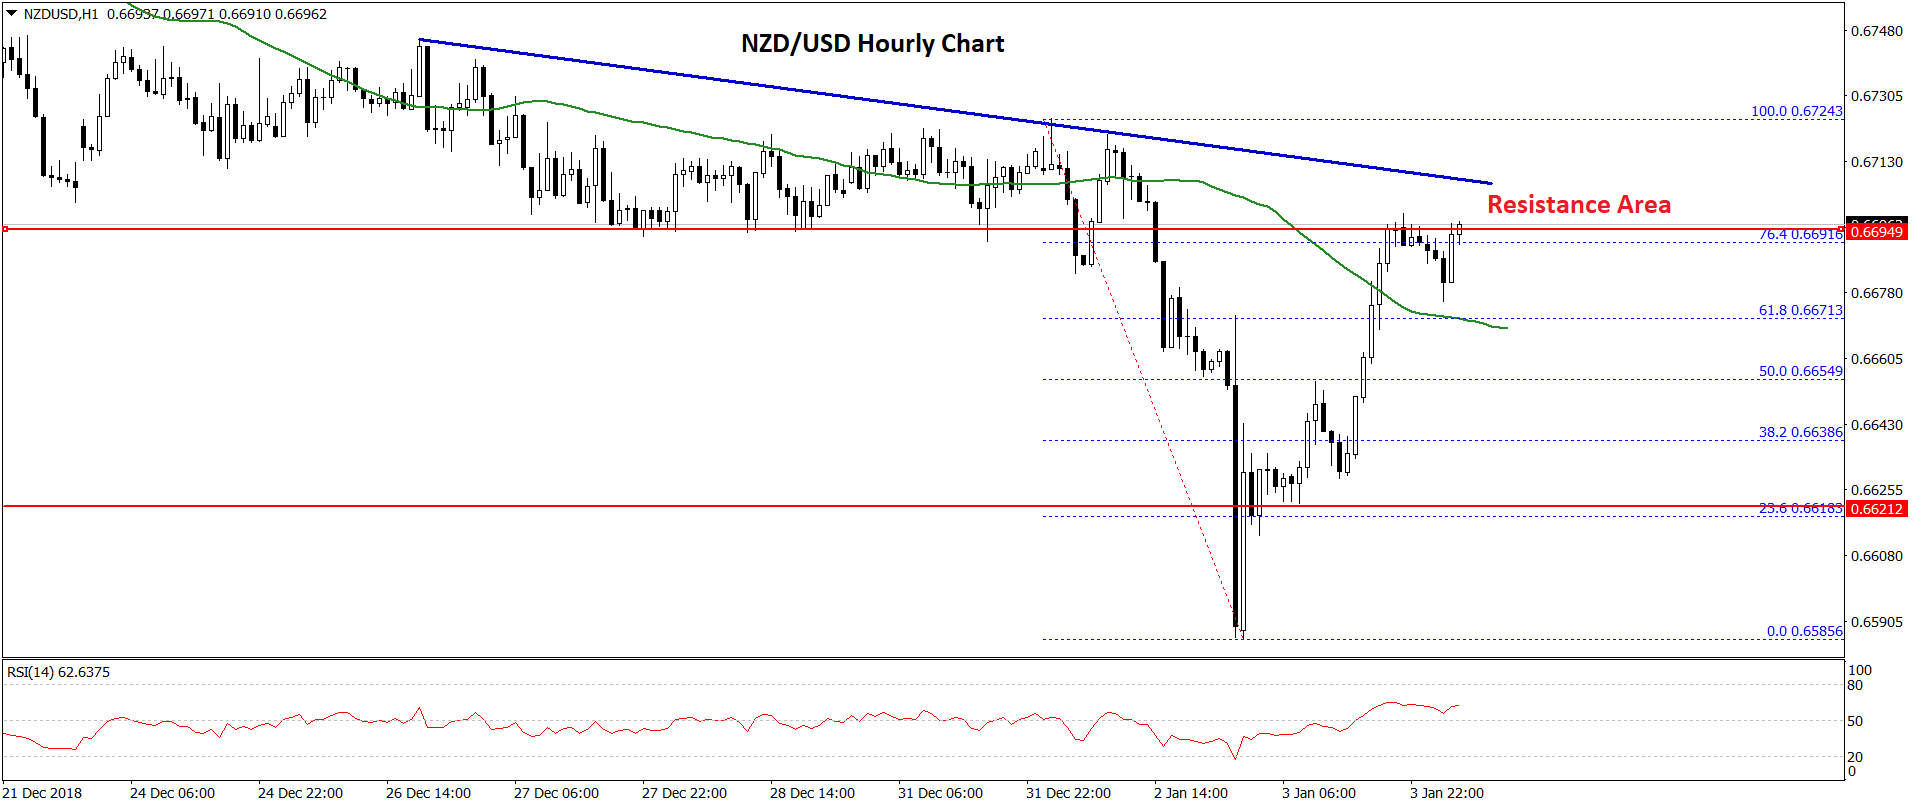
The pair is currently trading with a positive bias, but there is a strong resistance waiting near the 0.6700 level. Moreover, there is a major bearish trend line formed with resistance at 0.6710 on the hourly chart.
Finally, the 76.4% Fib retracement level of the recent decline from the 0.6724 high to 0.6585 low is also near the 0.6690 level to prevent more gains. Therefore, buyers need to push the pair above the 0.6690 and 0.6700 resistance levels to initiate a decent upward move.
On the downside, an initial support is placed near the 0.6620 level, below which the NZD/USD pair could decline towards the 0.6600 support area. Any further gains will most likely set the pace for a fresh low below the 0.6585 in the near term.
Trade over 50 forex markets 24 hours a day with FXOpen. Take advantage of low commissions, deep liquidity, and spreads from 0.0 pips (additional fees may apply). Open your FXOpen account now or learn more about trading forex with FXOpen.
This article represents the opinion of the Companies operating under the FXOpen brand only. It is not to be construed as an offer, solicitation, or recommendation with respect to products and services provided by the Companies operating under the FXOpen brand, nor is it to be considered financial advice.
Stay ahead of the market!
Subscribe now to our mailing list and receive the latest market news and insights delivered directly to your inbox.


Latest articles

Apple: Earnings Day Above the Activity Zone
On 30 April, after the market close, Apple Inc. will release its financial results for the second quarter of fiscal 2026. The consensus forecast, based on estimates from 31 analysts, points to revenue of around $109.7 billion, with expected

USD/JPY and USD/CHF Near Key Levels: The Dollar Supported by the Fed
The US dollar continues to trend upwards following the Federal Reserve meeting, drawing support from the regulator’s moderately hawkish stance and comments by Jerome Powell. Markets interpret the Fed’s rhetoric as a signal that restrictive policy is likely

EUR/USD and GBP/USD consolidate ahead of the Fed decision
European currencies are showing subdued dynamics, entering a consolidation phase following their previous advance. Earlier, EUR/USD and GBP/USD broke out of their ranges and strengthened; however, the subsequent correction has led both pairs to retest the previously breached