


AUD/USD And NZD/USD Likely To Continue Lower
FXOpen

AUD/USD remained in a bearish zone and broke the 0.6750 support area. NZD/USD is also declining and it is likely to continue lower below the 0.6480 support area.
Important Takeaways for AUD/USD and NZD/USD
- The Aussie Dollar declined heavily in the past few days from well above 0.6800 against the US Dollar.
- There is a major bearish trend line forming with resistance near 0.6725 on the hourly chart of AUD/USD.
- NZD/USD is sliding and it is now trading well below the 0.6520 pivot level.
- There is a key bearish trend line forming with resistance near 0.6500 on the hourly chart of NZD/USD.
AUD/USD Technical Analysis
After forming a top near the 0.6880 level, the Aussie Dollar started a strong decline against the US Dollar. The AUD/USD pair broke many supports near 0.6820 and 0.6800 to enter a bearish zone.
Moreover, there was a break below the 0.6750 support and the 50 hourly simple moving average. The recent decline was such that the pair traded close to the 0.6700 support area.
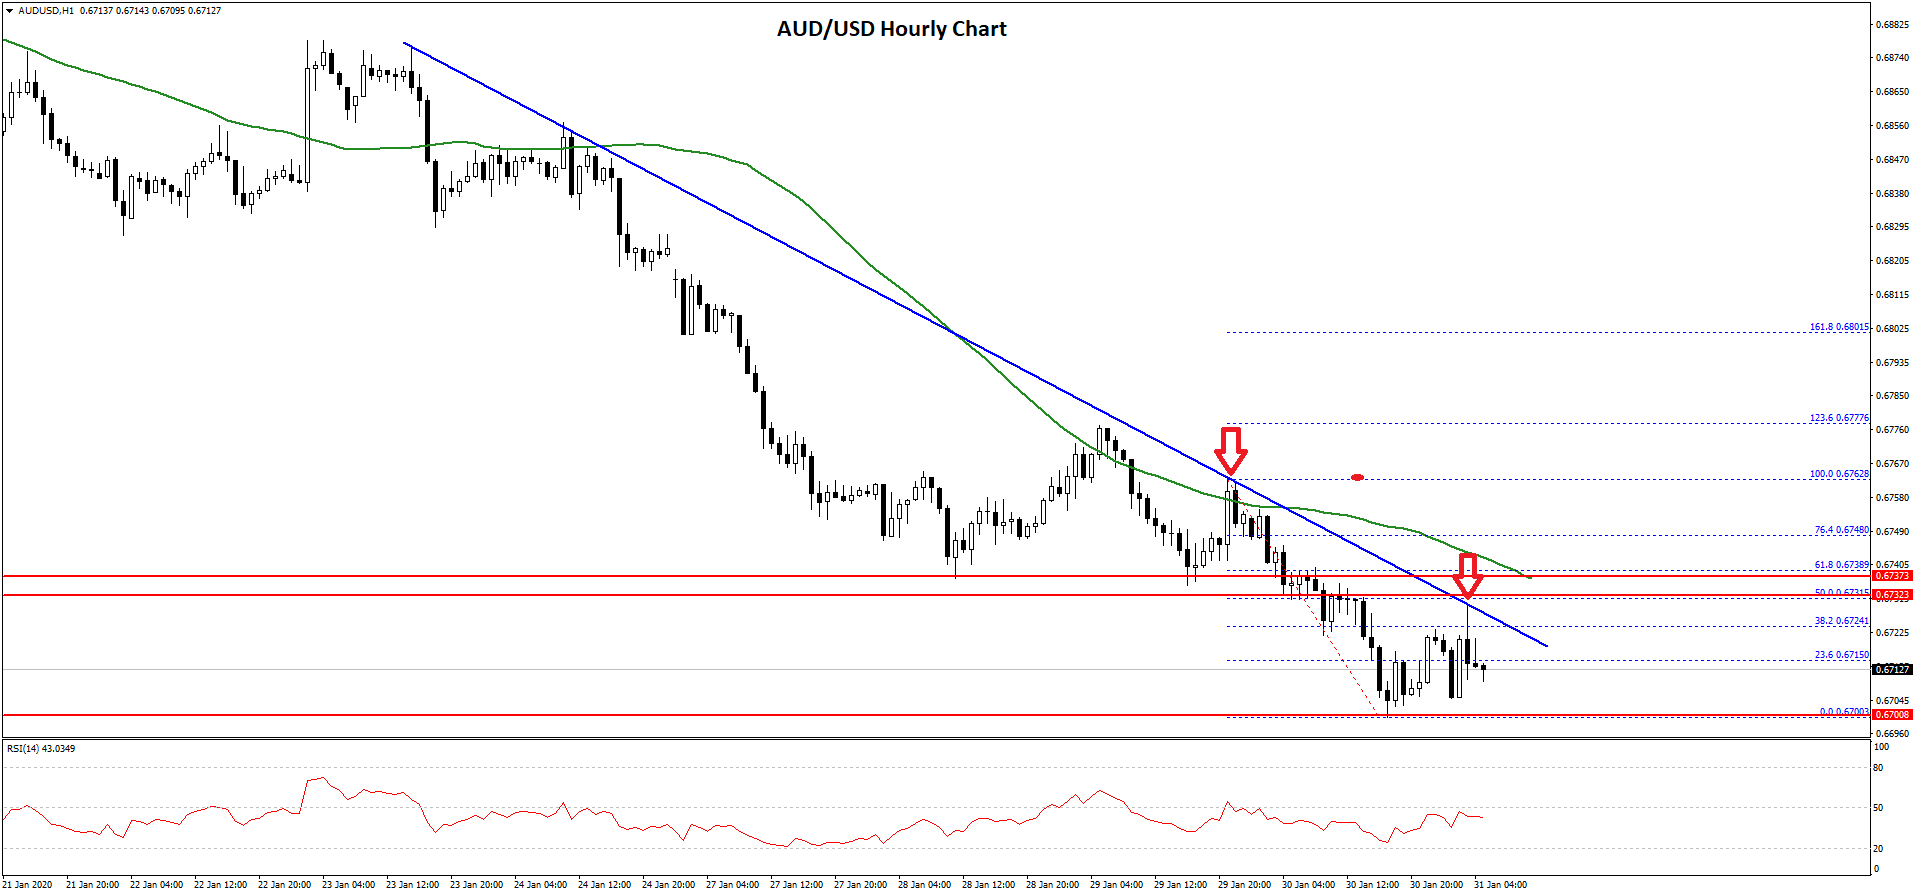
A low is formed near 0.6700 and the pair is currently consolidating losses. It tested the 38.2% Fib retracement level of the recent decline from the 0.6762 high to 0.6700 low.
However, there are many hurdles for the bulls on the upside near the 0.6725 and 0.6730 levels. Moreover, there is a major bearish trend line forming with resistance near 0.6725 on the hourly chart of AUD/USD.
The trend line is close to the 50% Fib retracement level of the recent decline from the 0.6762 high to 0.6700 low. Therefore, the pair must break the trend line and settle above 0.6730 to start a decent recovery.
The next key resistance is near 0.6750, above which the pair might correct towards the 0.6800 resistance. Conversely, the pair is likely to continue lower below the 0.6700 support.
The next support on the downside is near the 0.6680 level, below which there is a risk of more losses towards 0.6650 or 0.6620 in the near term.
NZD/USD Technical Analysis
The New Zealand Dollar also followed a similar pattern and declined heavily from well above the 0.6600 level against the US Dollar. The NZD/USD pair broke a few key supports near 0.6560 to move into a negative zone.
Moreover, the pair settled above the 0.6540 level and the 50 hourly simple moving average. Finally, there was a break below the 0.6500 level and the pair traded as low as 0.6478.
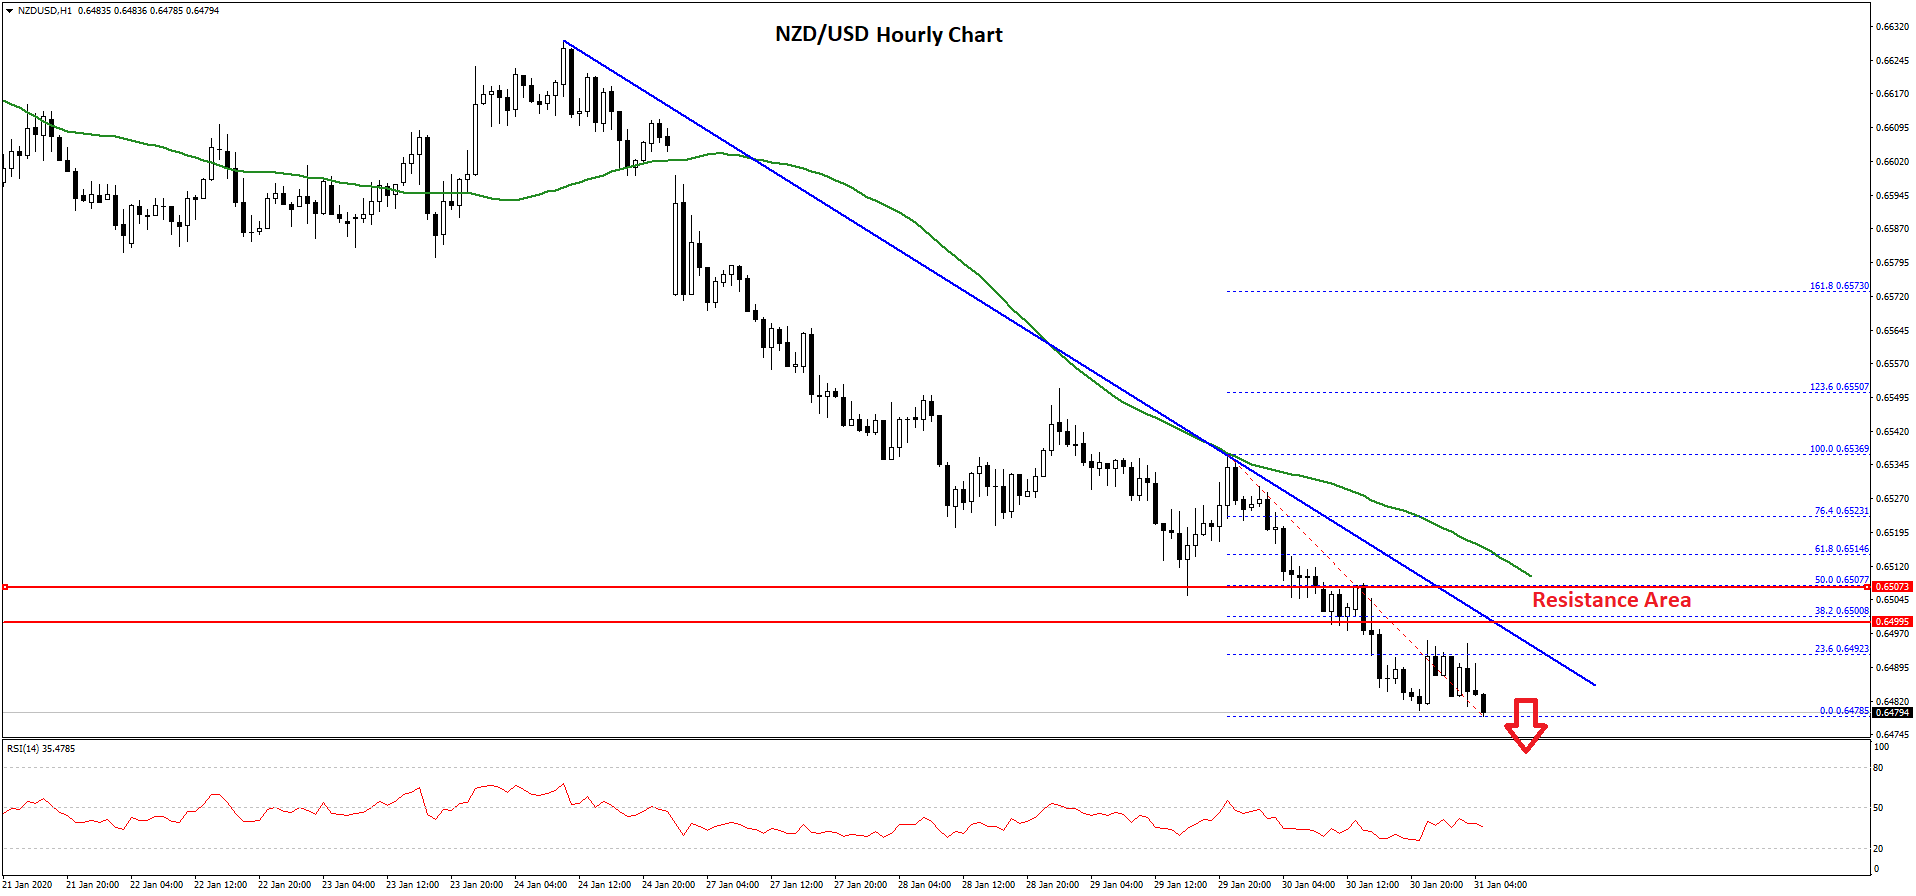
It is currently declining, with an immediate resistance near the 23.6% Fib retracement level of the recent decline from the 0.6536 high to 0.6478 low.
On the upside, there is a major hurdle forming near the 0.6500 level. Besides, there is a key bearish trend line forming with resistance near 0.6500 on the hourly chart of NZD/USD.
The 50% Fib retracement level of the recent decline from the 0.6536 high to 0.6478 low is also near the 0.6507 level along with the 50 hourly simple moving average.
Therefore, the pair needs to climb above the 0.6500 and 0.6510 resistance levels to start a decent correction. Conversely, the NZD/USD pair could decline below the 0.6480 support area and continue lower towards the 0.6440 level in the near term.
Trade over 50 forex markets 24 hours a day with FXOpen. Take advantage of low commissions, deep liquidity, and spreads from 0.0 pips (additional fees may apply). Open your FXOpen account now or learn more about trading forex with FXOpen.
This article represents the opinion of the Companies operating under the FXOpen brand only. It is not to be construed as an offer, solicitation, or recommendation with respect to products and services provided by the Companies operating under the FXOpen brand, nor is it to be considered financial advice.
Stay ahead of the market!
Subscribe now to our mailing list and receive the latest market news and insights delivered directly to your inbox.


Latest articles

EUR/USD Eyes Gains As USD/CHF Weakness Deepens Again
EUR/USD started a fresh increase above 1.1700 and 1.1720. USD/CHF declined further and is now struggling below 0.7835.
Important Takeaways for EUR/USD and USD/CHF Analysis Today
· The Euro started a decent increase from

Apple: Earnings Day Above the Activity Zone
On 30 April, after the market close, Apple Inc. will release its financial results for the second quarter of fiscal 2026. The consensus forecast, based on estimates from 31 analysts, points to revenue of around $109.7 billion, with expected

USD/JPY and USD/CHF Near Key Levels: The Dollar Supported by the Fed
The US dollar continues to trend upwards following the Federal Reserve meeting, drawing support from the regulator’s moderately hawkish stance and comments by Jerome Powell. Markets interpret the Fed’s rhetoric as a signal that restrictive policy is likely