


AUD/USD and NZD/USD Eyeing Further Upsides
FXOpen
AUD/USD started a nice upside move from 0.7530, broke the 0.7600 resistance, and is currently eyeing more upsides. NZD/USD is trading with a positive bias and is about to break a key contracting triangle.
Important Takeaways for AUD/USD and NZD/USD
- The Aussie Dollar traded higher recently and broke a major hurdle near 0.7600.
- There was a break above a contracting triangle with resistance at 0.7570 on the hourly chart of AUD/USD.
- NZD/USD is approaching a key break with support at 0.6995 and resistance near 0.7010.
- The Australian Retail Sales in April 2018 increased 0.4% (MoM), more than the forecast of +0.2%.
AUD/USD Technical Analysis
The Aussie Dollar formed a major support near 0.7510-20 and traded higher against the US Dollar. The AUD/USD pair moved above the 0.7550 and 0.7580 resistance levels to set the pace for more gains.
Later, the pair broke a contracting triangle with resistance at 0.7570 on the hourly chart to clear the path for further upsides. Lastly, the pair succeeded in clearing a crucial resistance near 0.7590-0.7600.
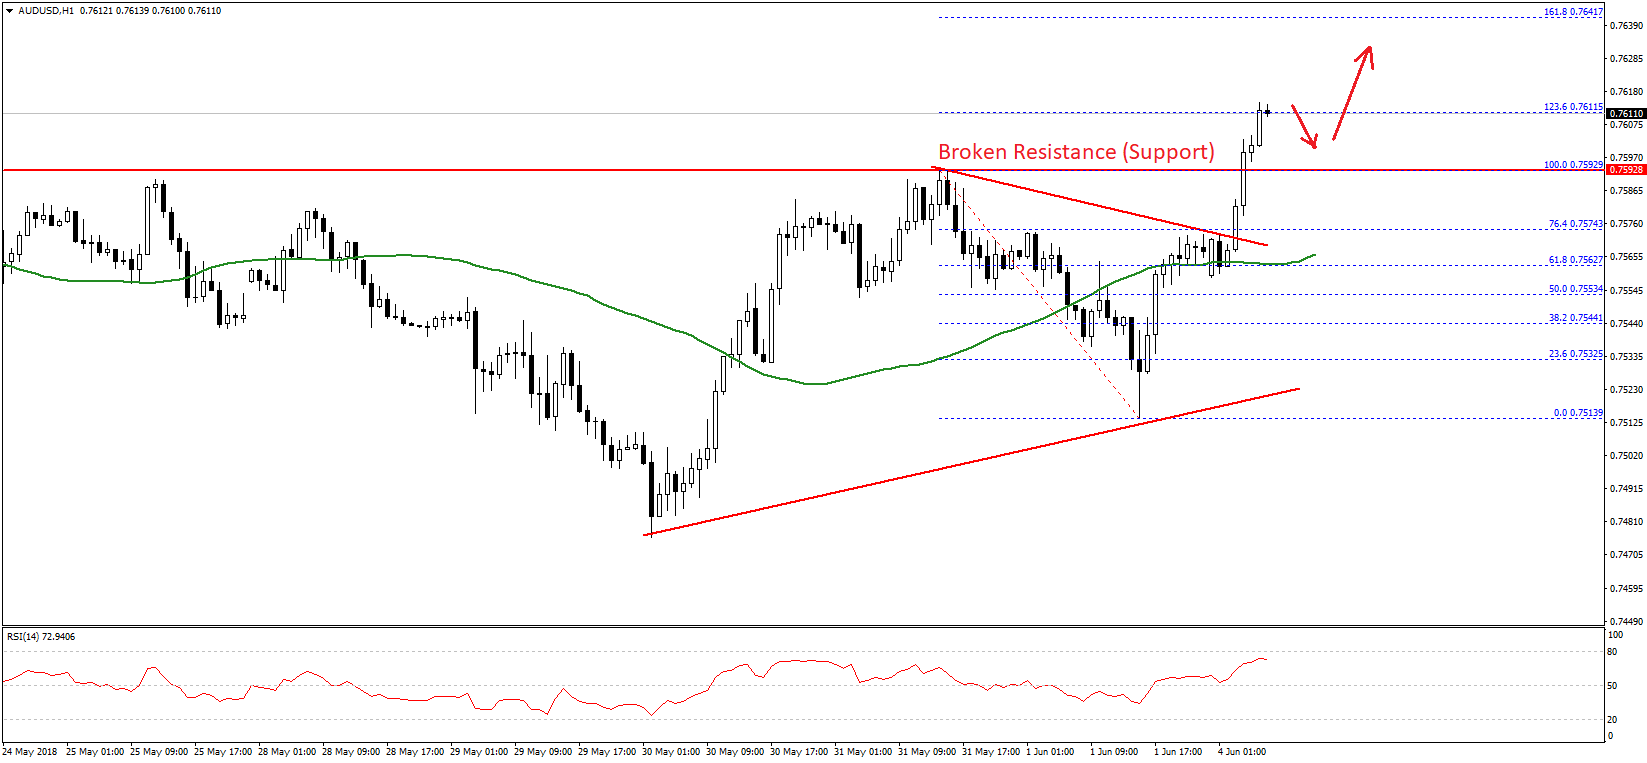
The pair is currently trading in a positive zone and is testing the 1.236 Fib extension level of the last decline from the 0.7592 high to 0.7513 low. In the short term, the pair may well correct a few pips and revisit the 0.7600 level.
The mentioned 0.7600 broken resistance is likely to act as a support. Below this, the pair might test the 0.7580 level. On the upside, a break above the 0.7615 level could push it towards the 0.7640 level.
The stated 0.7640 is a key barrier since it is the 1.618 Fib extension level of the last decline from the 0.7592 high to 0.7513 low.
Fundamentally, the Australian Retail Sales figure for April 2018 was released by the Australian Bureau of Statistics. The market was looking for a rise of 0.2% in sales in April 2018, compared with the previous month.
However, the outcome was on the higher side as there was a rise of 0.4% in sales, better than the last 0%. The report added that:
Food retailing (0.4%), Household goods retailing (0.4%), other retailing (0.2%), and Cafes, restaurants and takeaway food services (0.1%). Clothing, footwear and personal accessory retailing (-0.2%) and Department stores (-0.1%) fell in trend terms in April 2018
Overall, the market sentiment is positive for AUD/USD and the pair is likely to test the 0.7640 resistance in the near term.
NZD/USD Technical Analysis
The New Zealand Dollar started a downside correction after trading as high as 0.7023. The NZD/USD pair tested the 0.6960 level, which was a resistance earlier and acted as a support.
The pair started a fresh upside wave and moved above the 50% Fib retracement level of the last decline from the 0.7023 high to 0.6960 low. More importantly, the pair moved above the 0.7000 handle and the 50 hourly simple moving average.
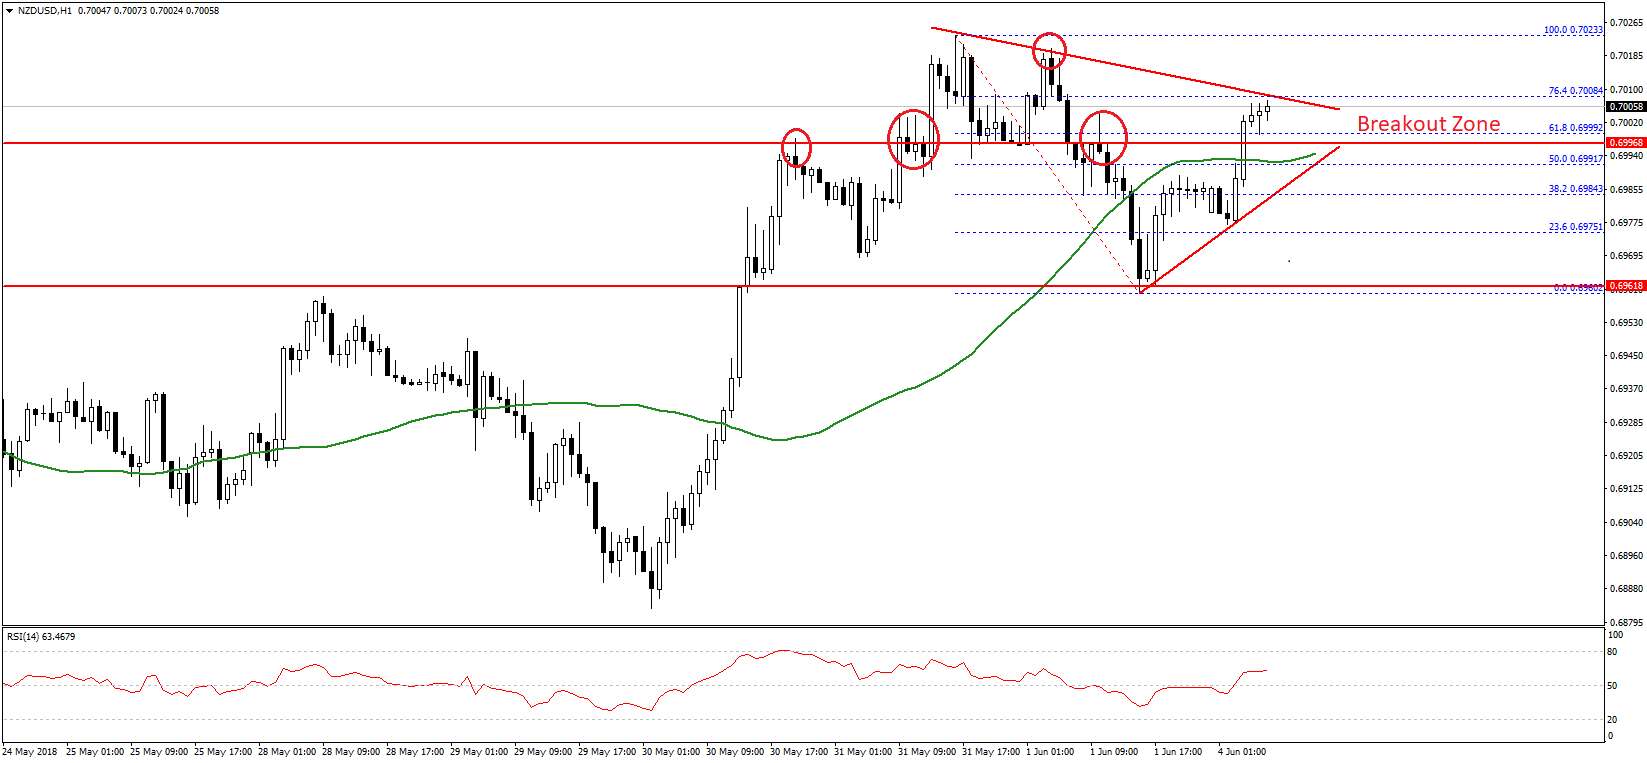
At the moment, the pair is approaching a key break since there is a contracting triangle in place with resistance at 0.7010. Above this, the pair may retest the 0.7023 high and it could even break it.
On the flip side, if the pair breaks the 0.7000 and 0.6995 support levels, it could retest the last low of 0.6960 in the near term.
Trade over 50 forex markets 24 hours a day with FXOpen. Take advantage of low commissions, deep liquidity, and spreads from 0.0 pips (additional fees may apply). Open your FXOpen account now or learn more about trading forex with FXOpen.
This article represents the opinion of the Companies operating under the FXOpen brand only. It is not to be construed as an offer, solicitation, or recommendation with respect to products and services provided by the Companies operating under the FXOpen brand, nor is it to be considered financial advice.
Stay ahead of the market!
Subscribe now to our mailing list and receive the latest market news and insights delivered directly to your inbox.


Latest articles

EUR/USD Eyes Gains As USD/CHF Weakness Deepens Again
EUR/USD started a fresh increase above 1.1700 and 1.1720. USD/CHF declined further and is now struggling below 0.7835.
Important Takeaways for EUR/USD and USD/CHF Analysis Today
· The Euro started a decent increase from

Apple: Earnings Day Above the Activity Zone
On 30 April, after the market close, Apple Inc. will release its financial results for the second quarter of fiscal 2026. The consensus forecast, based on estimates from 31 analysts, points to revenue of around $109.7 billion, with expected

USD/JPY and USD/CHF Near Key Levels: The Dollar Supported by the Fed
The US dollar continues to trend upwards following the Federal Reserve meeting, drawing support from the regulator’s moderately hawkish stance and comments by Jerome Powell. Markets interpret the Fed’s rhetoric as a signal that restrictive policy is likely