


FXOpen

BTC/USD
Last Tuesday the price of Bitcoin was sitting at $10948 which was the first lower high after an attempt for interaction with the 0.382 Fibonacci level. As the price was in a downward trajectory it fell by 10.18% moving slightly below the symmetrical triangle's support level but the price found support there and started recovering. The recovery which followed has been stopped out at the 0.236 Fib level on two occasions which is why we are seeing the price being struck in this range and is forming a cluster.
From last week nothing has changed much on a macro level. The price of Bitcoin is still in a symmetrical triangle but its apex is getting close which is why a breakout might occur soon if it’s not already on its way as the price is currently staring to move below the triangle’s support. 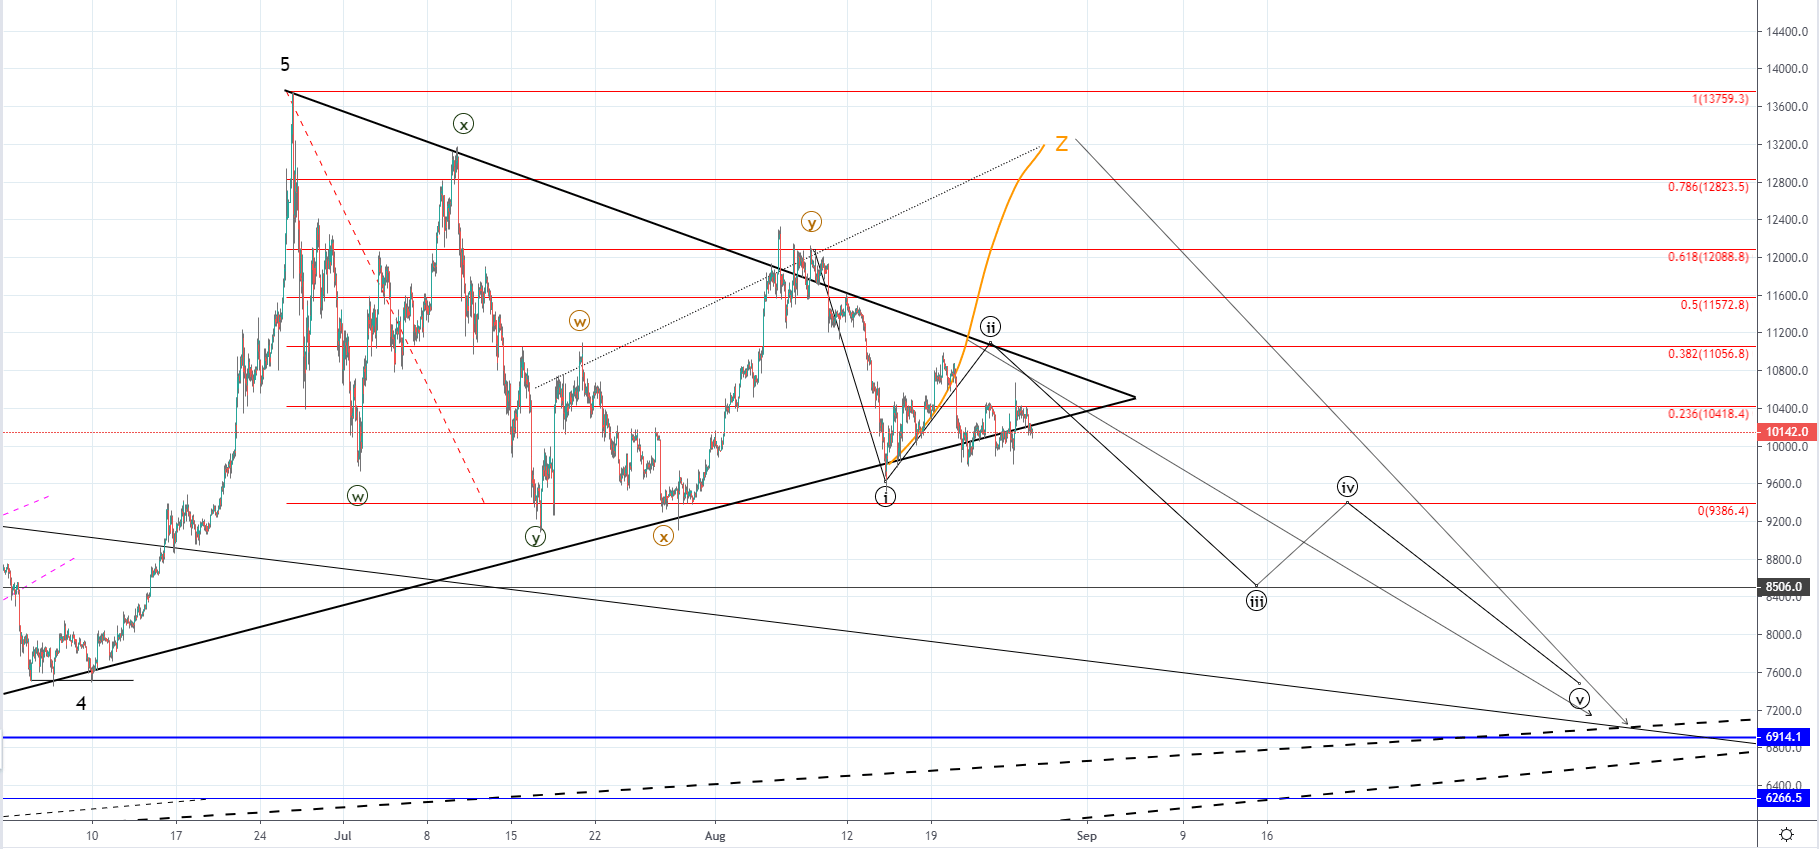 On the hourly chart, you can see that the sellers have been putting a lot of pressure at the 0.236 Fib line and that the triangle’s support level hasn’t been respected properly which could serve as a first indication that more likely we are to see a breakout to the downside. This breakout would be the third structure from the yearly high with the first two being three-wave corrections the third one could be the five-wave move to the downside and would be the C wave of the higher degree.
As the 0 Fib level would serve as another support level on the way down its surpassing would indicate a proper breakout and not from the symmetrical triangle’s support level as there is still a chance for the price to go to its yearly high for a retest before a stronger downside move. In either way, I would be expecting the price of Bitcoin to start moving to the downside after this current cluster completes and the most optimal price target for the expected decrease would be at the multiple support point intersection at around $6900 area.
XRP/USD
The price of Ripple has been attempting to hold above its lower horizontal support level at $0.26617 which is below the significant one at $0.29450 and has formed a symmetrical triangle which could be interpreted as a bearish pennant. The pennant is known as a trend continuation pattern which is why we could see a breakout to the downside but the price of Ripple is at its lowest levels since September last year and has fallen by over 50% from its yearly high which is why we could see the level holding with the recovery to the upside starting soon.
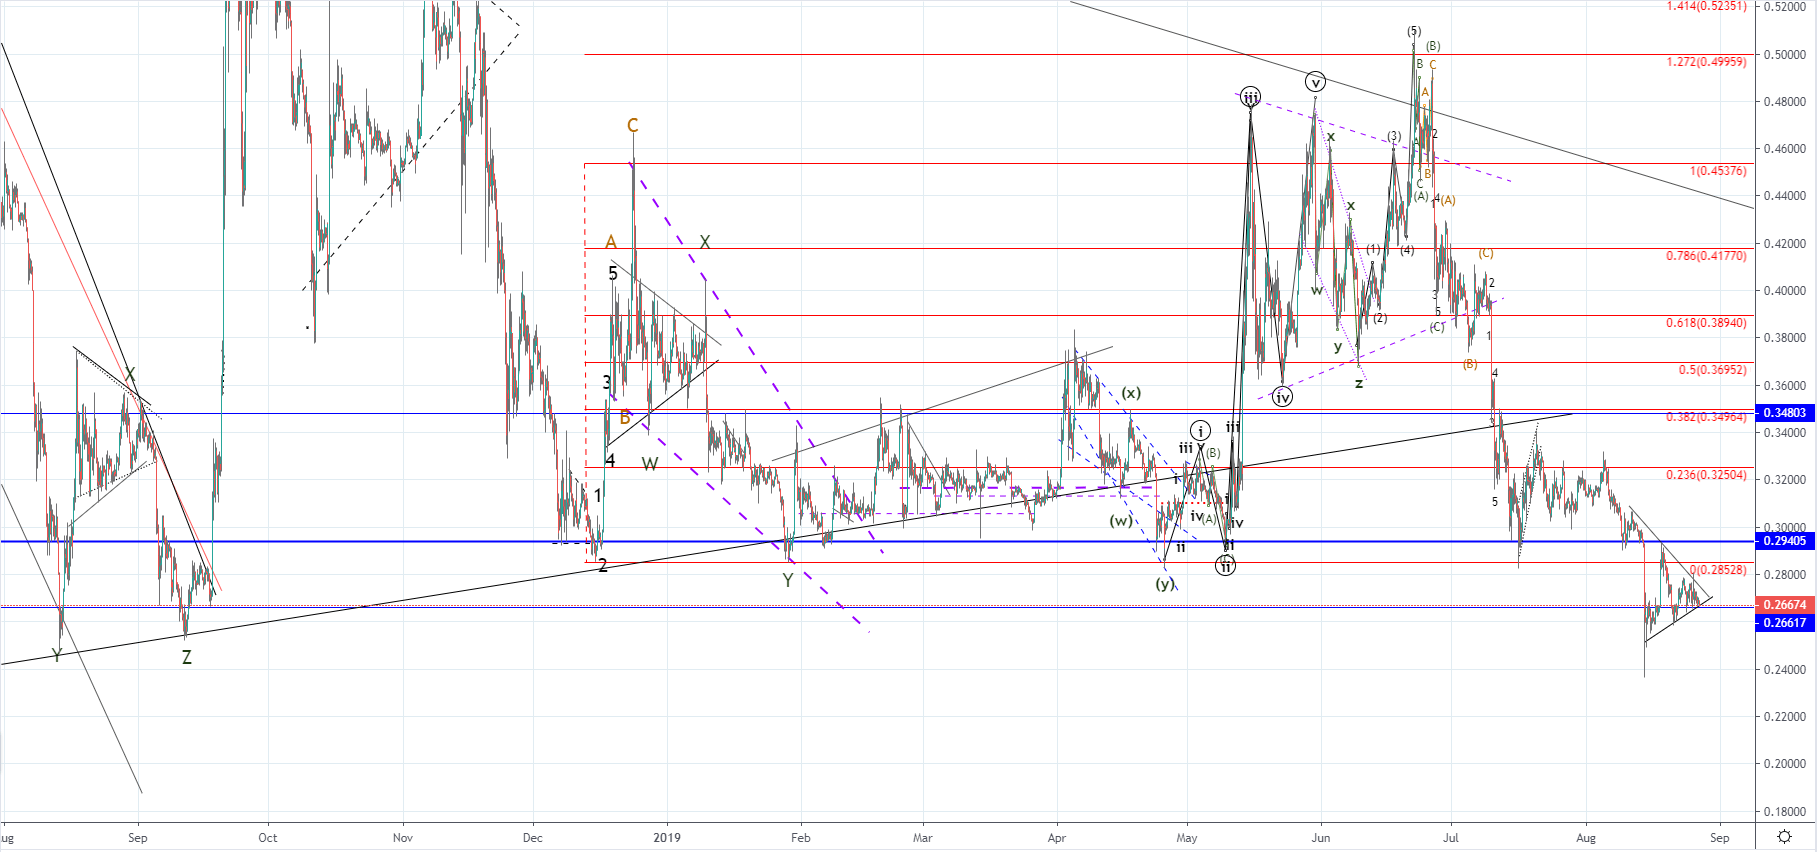 On the 4-hour chart, you can see the significance behind the $0.26617 level as there aren’t any horizontal support levels close below it. If the price continues moving to the downside below this support level and we see a breakout with strong bearish momentum the next significant support level which could stop out the sell-off would be at $0.22 but the furthers one could even be at $0.1518.
From the yearly high we have seen a five-wave decrease which is why I don’t believe that the price of Ripple would be headed significantly lower but another lower low could occur before we see another recovery.
FXOpen offers the world's most popular cryptocurrency CFDs*, including Bitcoin and Ethereum. Floating spreads, 1:2 leverage — at your service. Open your trading account now or learn more about crypto CFD trading with FXOpen.
*Important: At FXOpen UK, Cryptocurrency trading via CFDs is only available to our Professional clients. They are not available for trading by Retail clients. To find out more information about how this may affect you, please get in touch with our team.
This article represents the opinion of the Companies operating under the FXOpen brand only. It is not to be construed as an offer, solicitation, or recommendation with respect to products and services provided by the Companies operating under the FXOpen brand, nor is it to be considered financial advice.
Stay ahead of the market!
Subscribe now to our mailing list and receive the latest market news and insights delivered directly to your inbox.


Latest articles

S&P 500 Index: Chart Analysis After Friday’s Sell-Off
Trading on 12 December was overshadowed by a sharp decline in the S&P 500 (US SPX 500 mini on FXOpen), with the session low approaching December’s previous trough.
Among the key fundamental drivers behind Friday’s drop

Market Analysis: AUD/USD and NZD/USD Test Support, Break or Bounce Next?
AUD/USD is attempting a fresh increase from 0.6630. NZD/USD is consolidating and could aim for a move above 0.5800 in the short term.
Important Takeaways for AUD/USD and NZD/USD Analysis Today
· The Aussie Dollar

USD/JPY Slides Towards Key Support
A Bank of Japan monetary policy meeting is due this week, and expectations around the decision are supporting the yen today. Traders increasingly believe that the central bank may raise its policy rate by 25 basis points to 0.75%