Bitcoin and Ripple - a breakout to the downside looks close
BTC/USD
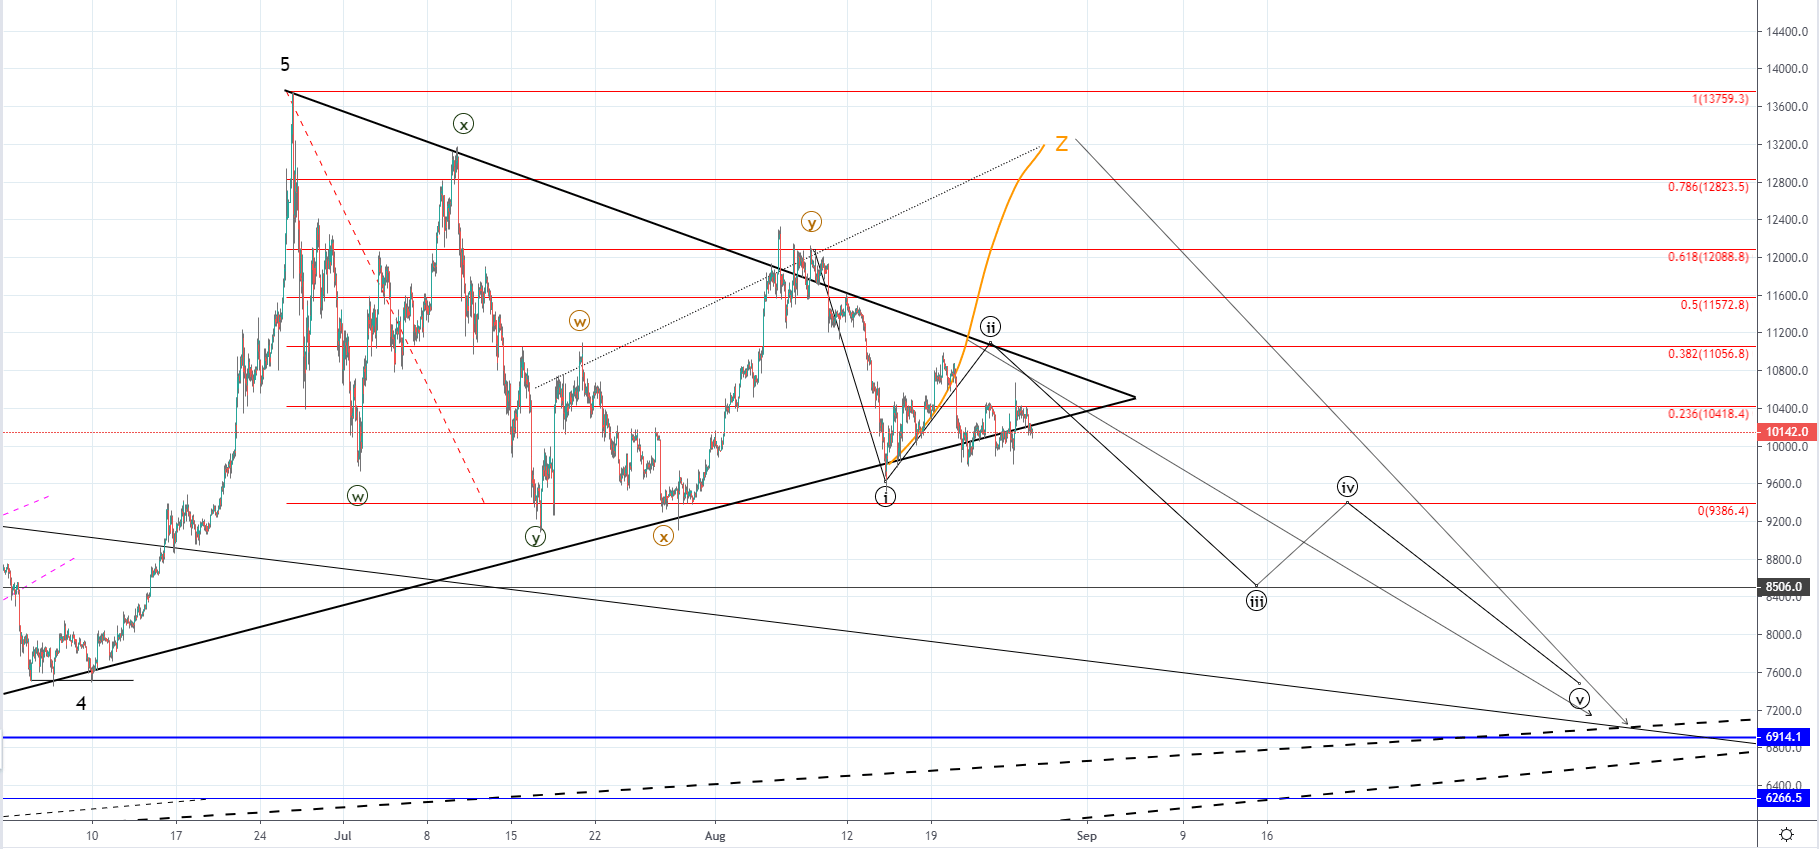
Last Tuesday the price of Bitcoin was sitting at $10948 which was the first lower high after an attempt for interaction with the 0.382 Fibonacci level. As the price was in a downward trajectory it fell by 10.18% moving slightly below the symmetrical triangle's support level but the price found support there and started recovering. The recovery which followed has been stopped out at the 0.236 Fib level on two occasions which is why we are seeing the price being struck in this range and is forming a cluster.
From last week nothing has changed much on a macro level. The price of Bitcoin is still in a symmetrical triangle but its apex is getting close which is why a breakout might occur soon if it’s not already on its way as the price is currently staring to move below the triangle’s support.
As the 0 Fib level would serve as another support level on the way down its surpassing would indicate a proper breakout and not from the symmetrical triangle’s support level as there is still a chance for the price to go to its yearly high for a retest before a stronger downside move. In either way, I would be expecting the price of Bitcoin to start moving to the downside after this current cluster completes and the most optimal price target for the expected decrease would be at the multiple support point intersection at around $6900 area.
XRP/USD
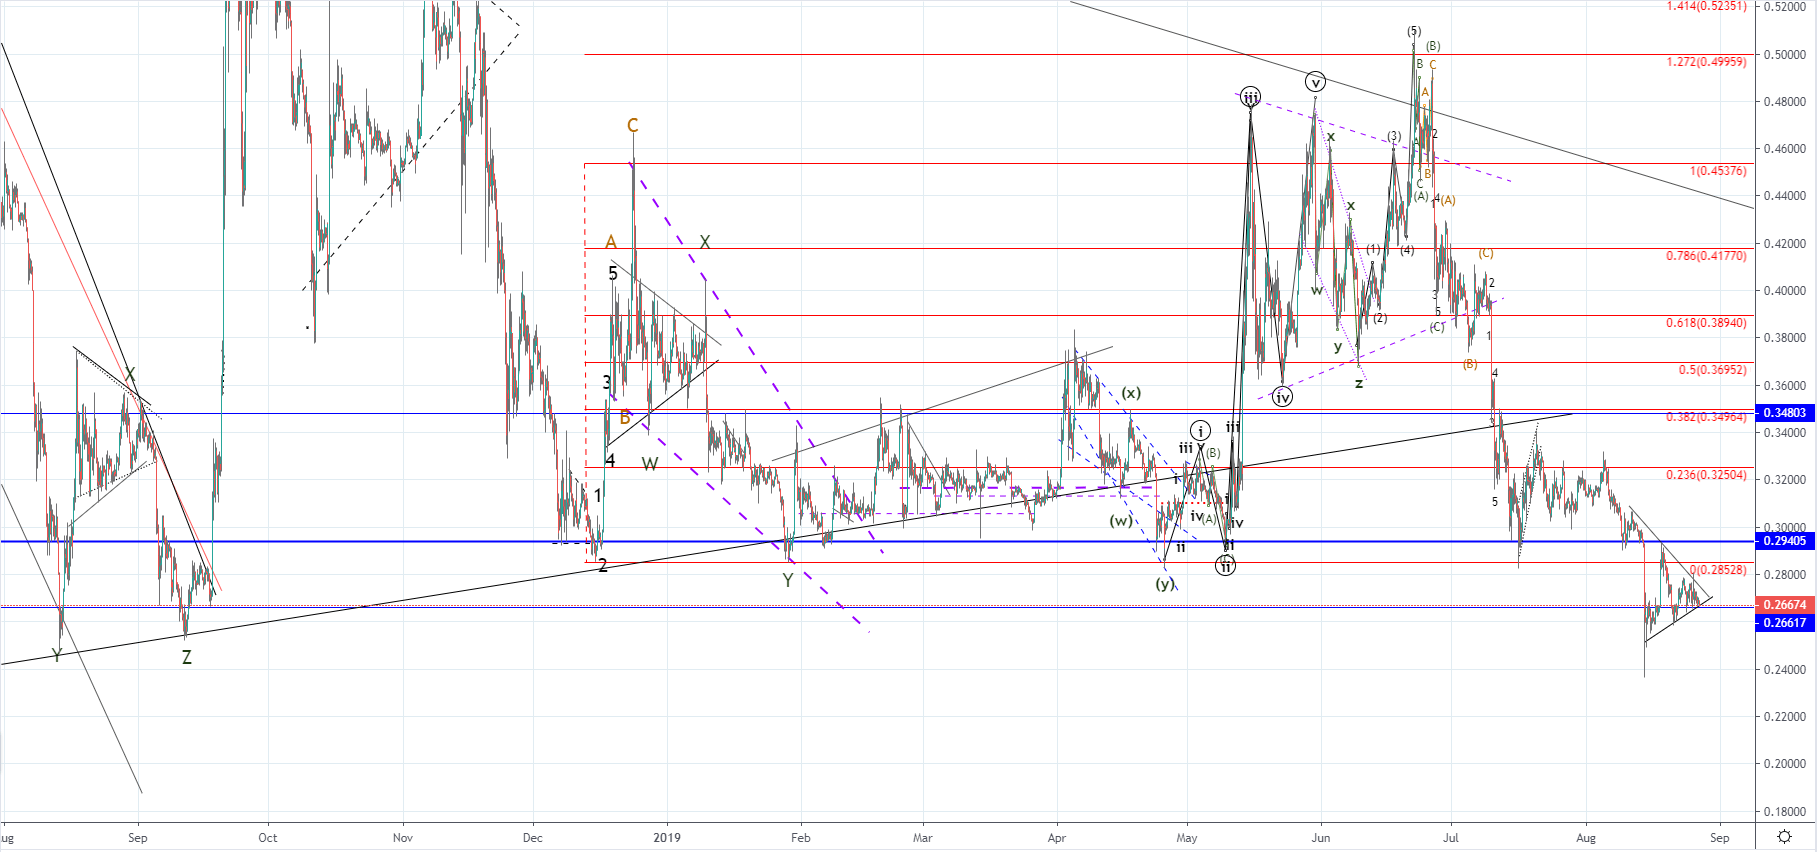
The price of Ripple has been attempting to hold above its lower horizontal support level at $0.26617 which is below the significant one at $0.29450 and has formed a symmetrical triangle which could be interpreted as a bearish pennant. The pennant is known as a trend continuation pattern which is why we could see a breakout to the downside but the price of Ripple is at its lowest levels since September last year and has fallen by over 50% from its yearly high which is why we could see the level holding with the recovery to the upside starting soon.
From the yearly high we have seen a five-wave decrease which is why I don’t believe that the price of Ripple would be headed significantly lower but another lower low could occur before we see another recovery.