Bitcoin and Ripple - Next move will dictate longer trend development
BTC/USD
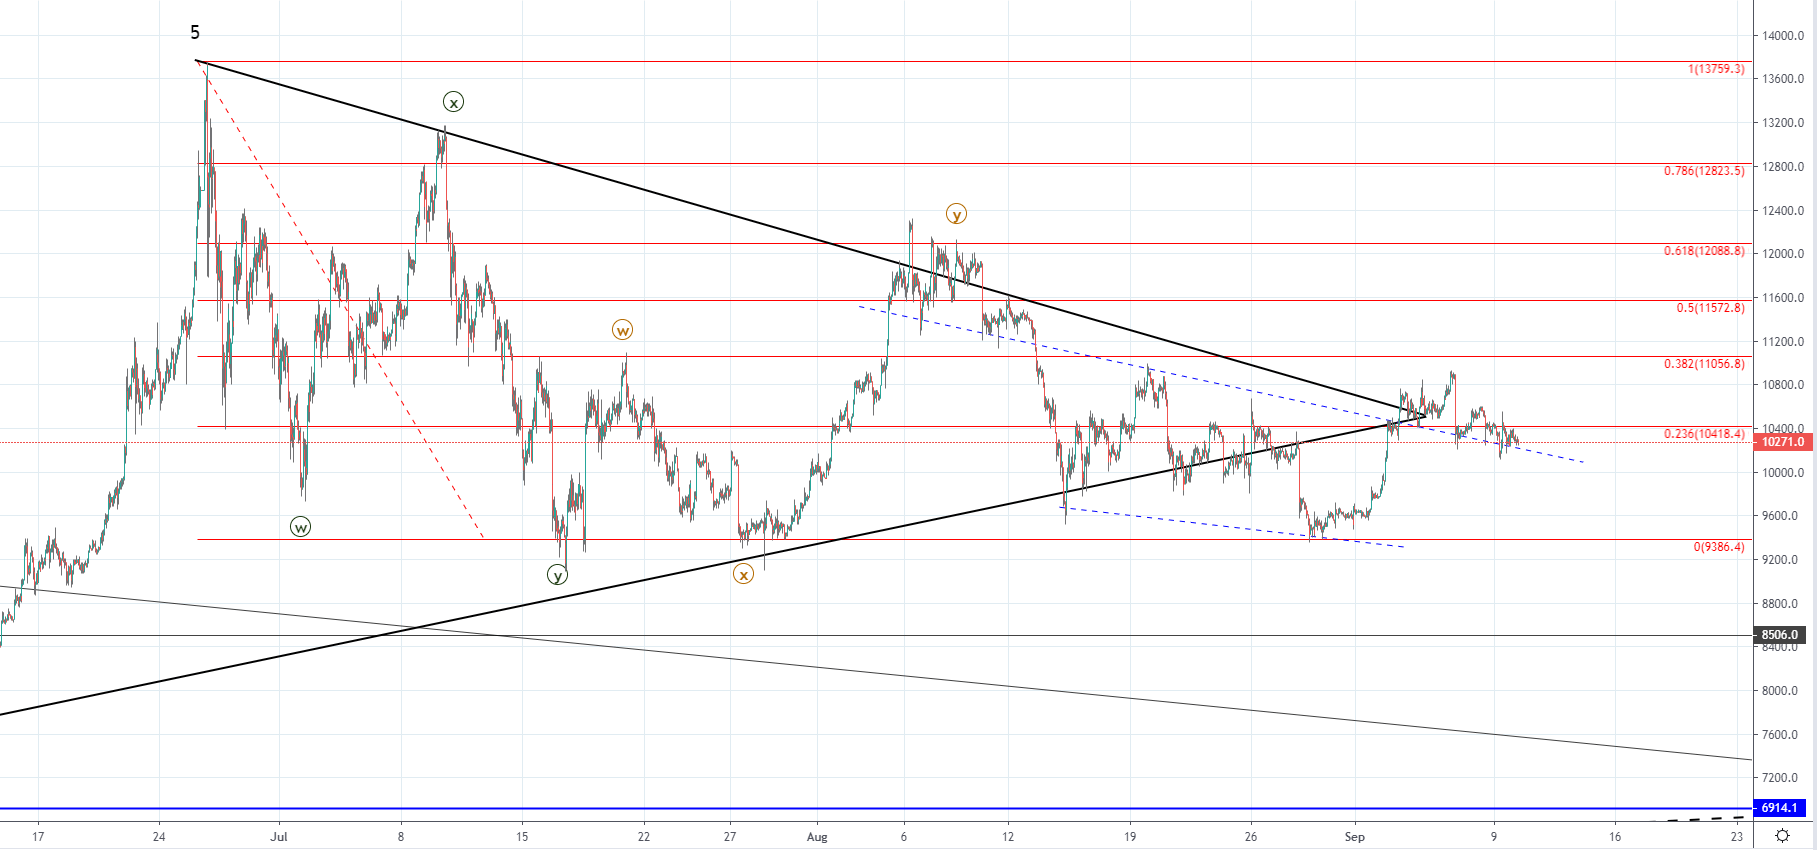
Last week on Monday the price of Bitcoin was sitting at $9723.8 at the open from where we’ve seen an increase of 12.11% until Friday’s high when the price reached $10901 at its highest point. From Friday’s high the price has depreciated by 6.71% to Monday’s low at $10172 and but has recovered since and is currently sitting slightly above at around $10271.
Since the yearly high was made we’ve seen a correction taking place inside the triangle structure and it consisted of two WXY three-wave corrections which is why after the second Y wave ended around the 0.618 Fib level the third structure is likely developing. As the third structure is likely to push the price for a lower low a breakout to the downside looks more likely but we could see the current recovery continuing for another attempt for a breakout to the upside.
XRP/USD
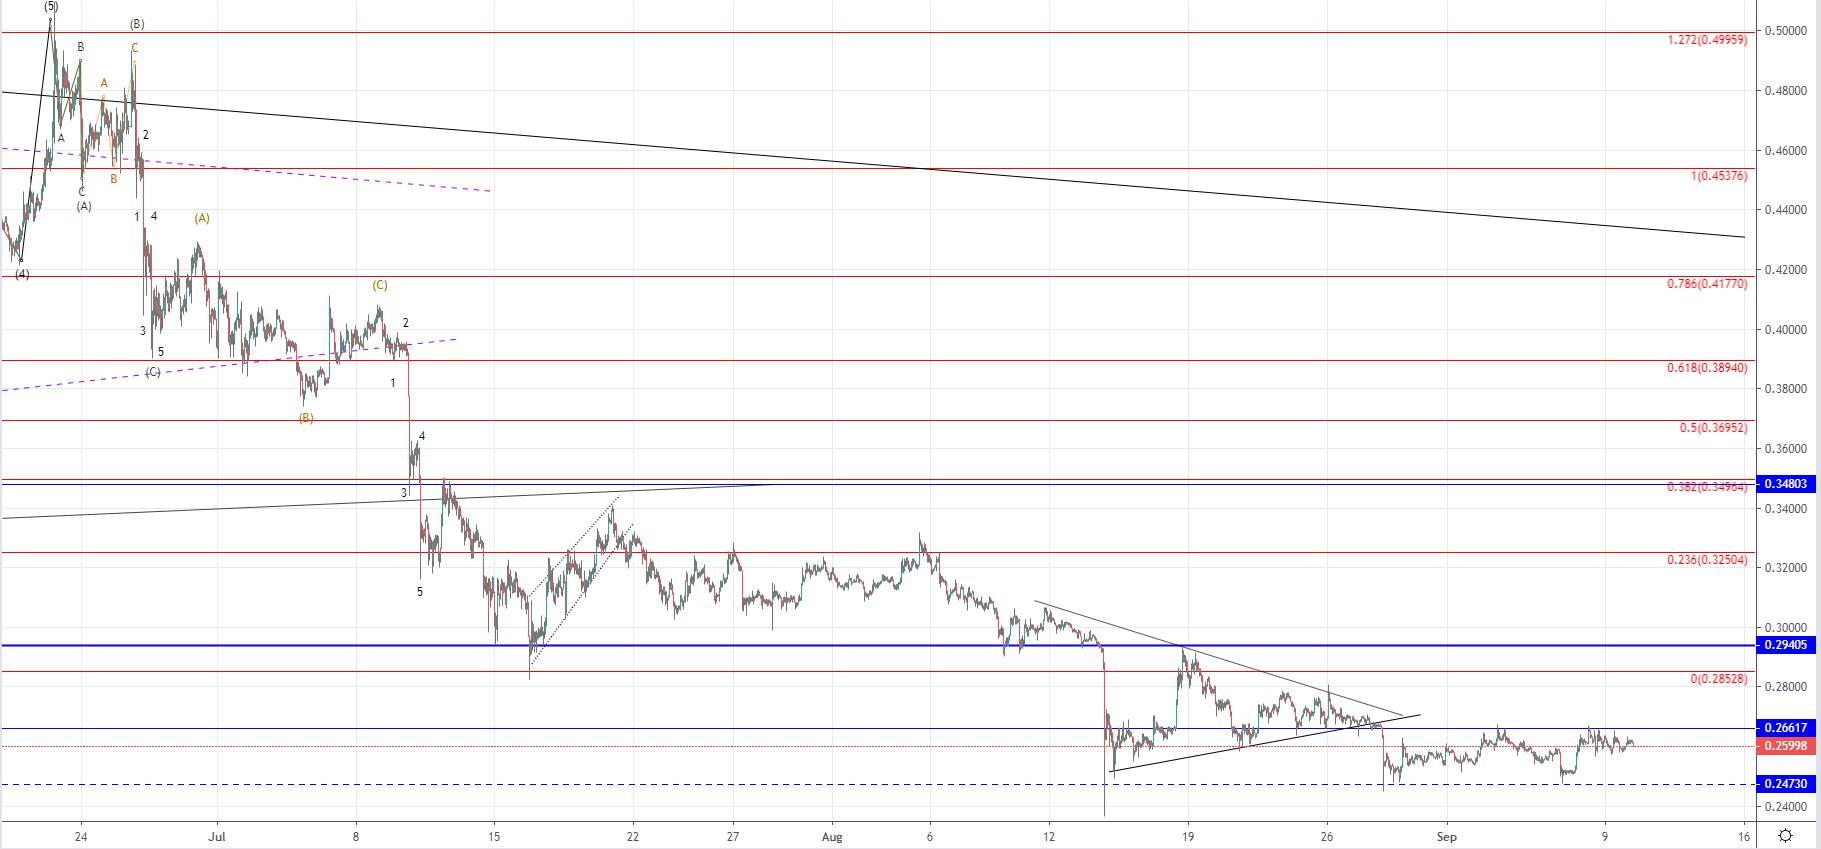
The price of Ripple has been stuck in a horizontal range from $0.24730 with its median line being the Monday’s low at $0.25393 and its resistance level being at $0.26617. From last Monday’s low which was an interaction with the median level we’ve seen an increase to its resistance level but another minor retracement after the interaction ended as rejection with the price currently sitting at around $0.26.