


Bitcoin and Ripple showing signs of weakness
FXOpen

BTC/USD
The price of Bitcoin has been decreasing from last Tuesday when it spiked up t0 $12315 at its highest point and came down to $11297 today which is a decrease of slightly over 8%. Last Tuesday’s spike was an interaction with the 0.618 Fibonacci level which ended as rejection with the price currently testing the 0.382 Fib level for support.
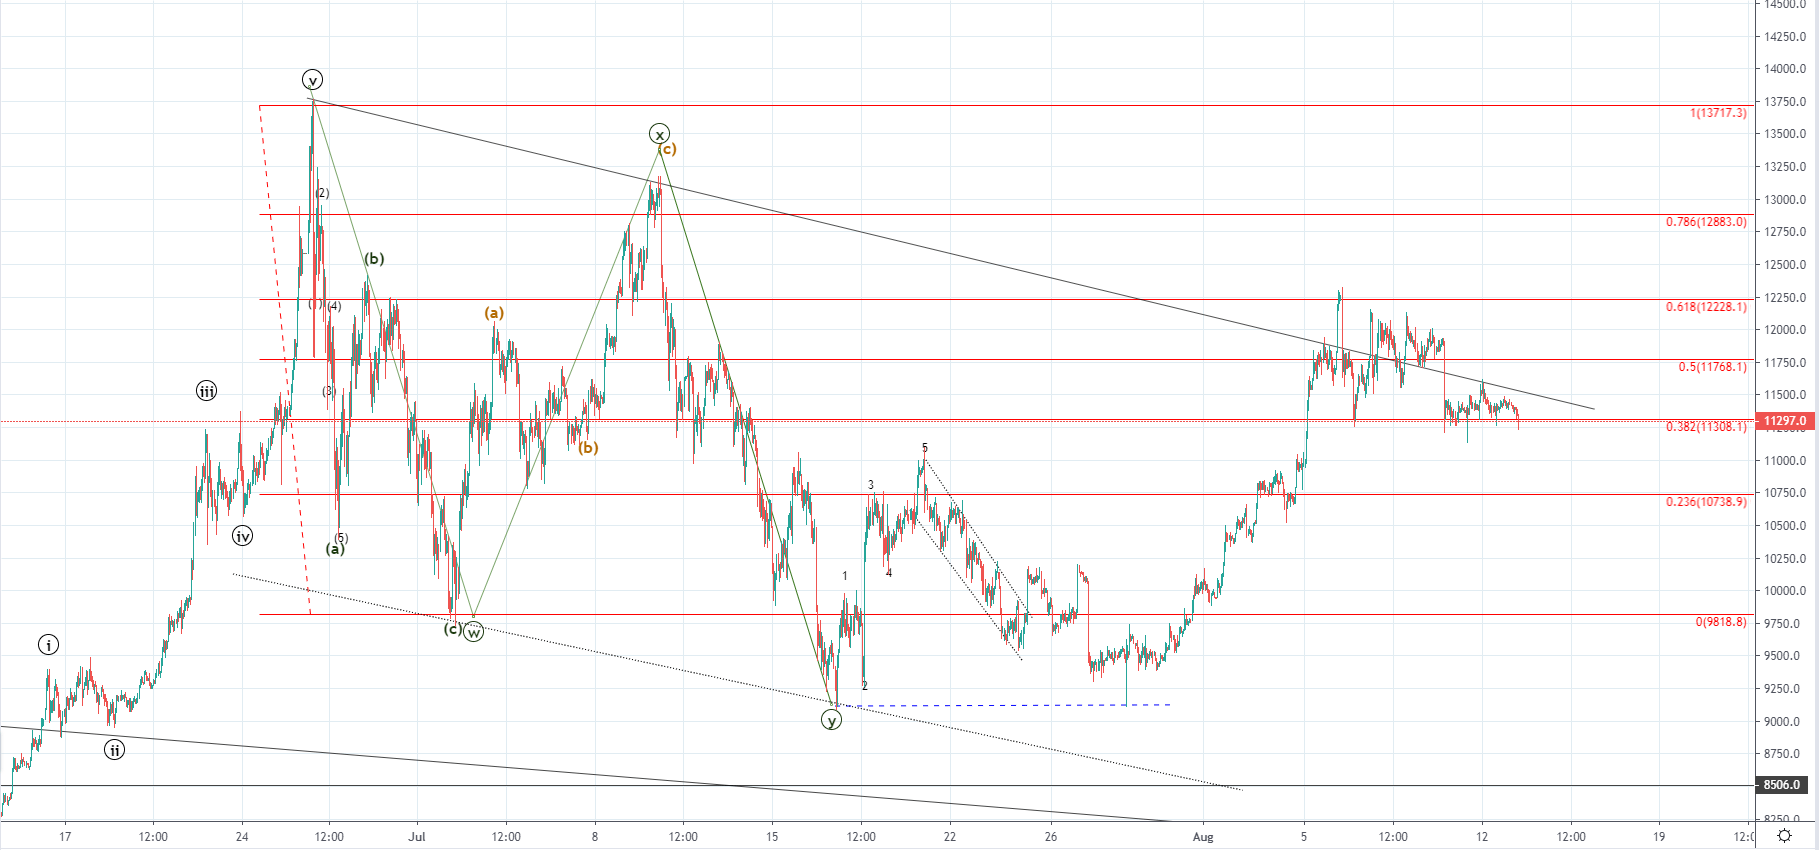 On the hourly chart, you can see that the price is still back inside the territory of the descending channel as the attempt for a breakout to the upside failed. The price came only up for a lower high before a cluster has been formed above the 0.5 Fib line but a straight downfall has been seen below the horizontal level. This could be an early indication that the price isn’t continuing its upward trajectory as most likely a retracement has started developing.
That doesn’t mean that after the retracement ends potentially on the next Fib level to the downside at 0.236 we can’t see the uptrend continuation, especially if from 17th of July we are seeing the development of the next five-wave move to the upside as the WXY correction ended. If the price fall below the 0.236 Fib level it would enter the territory of the presumed 2nd wave of a higher degree which would invalidate a possibility of another higher high as we have in that case seen a three-wave corrective upside move.
But if the price finds support at the present levels or starts moving to the downside but manages to stay above $10738 another increase to the 0.786 Fib level would be expected which would be its 5th wave and would indicate further increase as a breakout would occur from the descending channel
XRP/USD
From last Monday till Friday the price of Ripple has decreased by around 12% coming from $0.33141 to $0.2908 at its lowest spike but started recovering over the weekend when it reached $0.3065 on Sunday. Since then the price has been decreasing again as it fell to its most significant horizontal support level at $0.29405 which was retested for support. Currently, the price is being traded slightly higher as the support was there but there haven’t been any signs of interest for the buyer’s side since then as we haven’t seen a strong recovery.
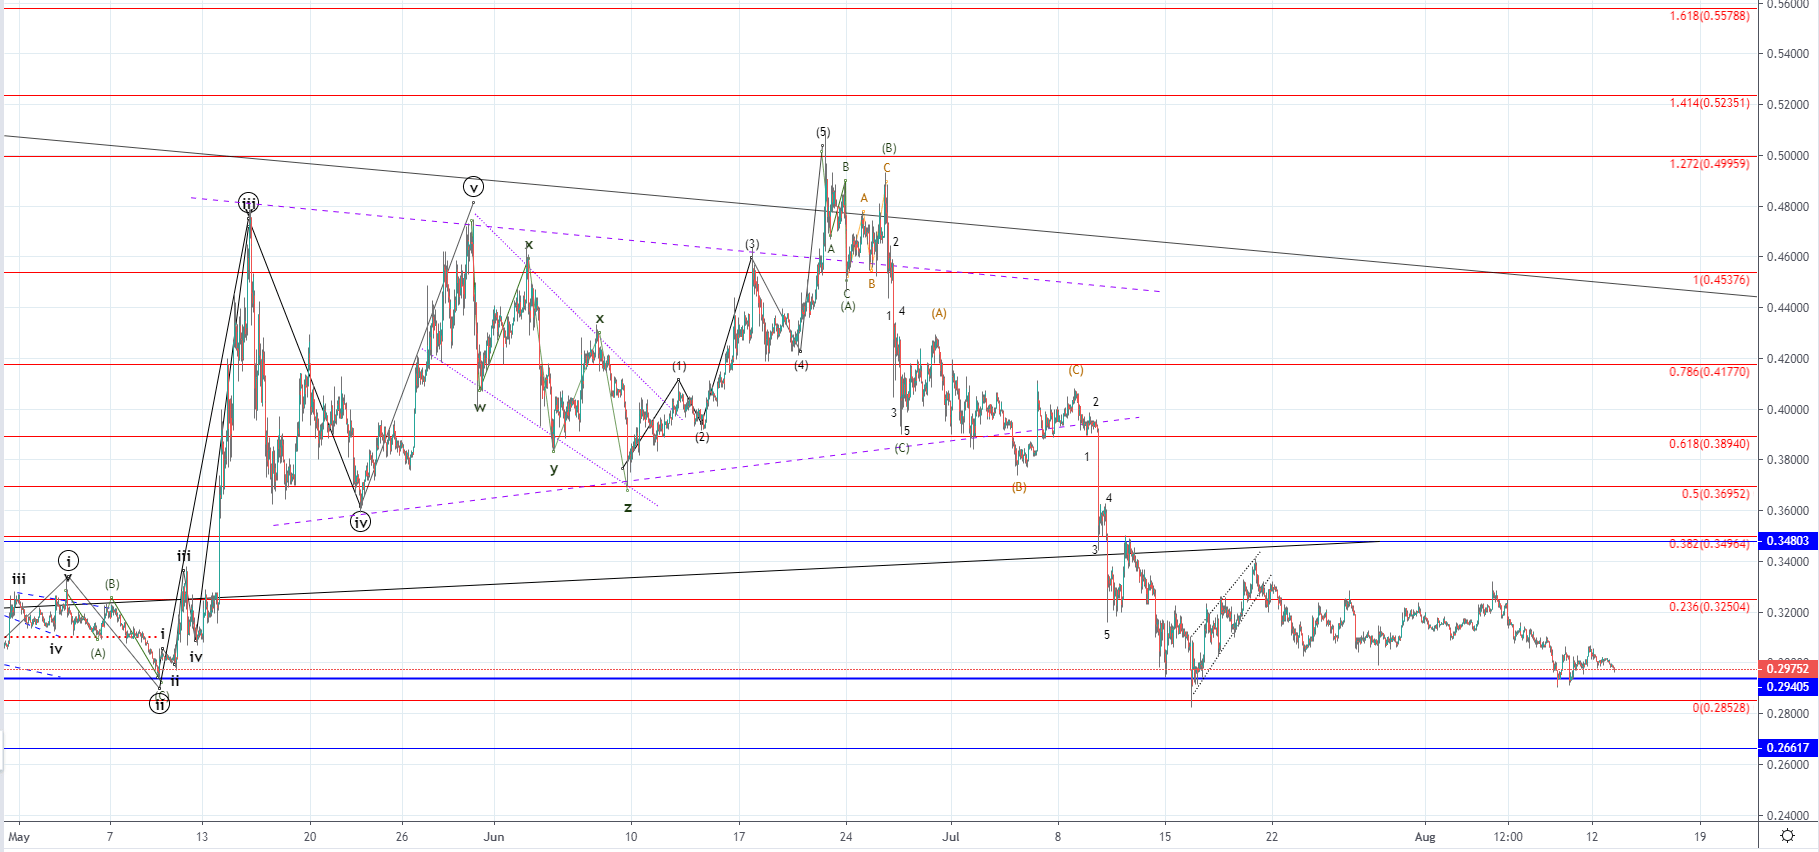 The price is in a downward trajectory which can lead to another test of the horizontal level but the price could continue moving below the significant level as it might not hold for much longer. Considering that the price fell by 42% in one go from the 1.272 Fib level where it got rejected and has formed a horizontal range with a lower high, this range could be interpreted as a consolidative move before the downfall continues.
Another possibility would be that the price has reached its key support level from where buying should be initiated but since we haven’t seen significant recovery after the first interaction before a lower high was made and another retest of the level, this isn’t as likely. If the price continues moving below the significant horizontal level the next one which is likely to be interacted with would be at $0.26617.
FXOpen offers the world's most popular cryptocurrency CFDs*, including Bitcoin and Ethereum. Floating spreads, 1:2 leverage — at your service (additional fees may apply). Open your trading account now or learn more about crypto CFD trading with FXOpen.
*Important: At FXOpen UK, Cryptocurrency trading via CFDs is only available to our Professional clients. They are not available for trading by Retail clients. To find out more information about how this may affect you, please get in touch with our team.
This article represents the opinion of the Companies operating under the FXOpen brand only. It is not to be construed as an offer, solicitation, or recommendation with respect to products and services provided by the Companies operating under the FXOpen brand, nor is it to be considered financial advice.
Stay ahead of the market!
Subscribe now to our mailing list and receive the latest market news and insights delivered directly to your inbox.


Latest articles

Apple: Earnings Day Above the Activity Zone
On 30 April, after the market close, Apple Inc. will release its financial results for the second quarter of fiscal 2026. The consensus forecast, based on estimates from 31 analysts, points to revenue of around $109.7 billion, with expected

USD/JPY and USD/CHF Near Key Levels: The Dollar Supported by the Fed
The US dollar continues to trend upwards following the Federal Reserve meeting, drawing support from the regulator’s moderately hawkish stance and comments by Jerome Powell. Markets interpret the Fed’s rhetoric as a signal that restrictive policy is likely

EUR/USD and GBP/USD consolidate ahead of the Fed decision
European currencies are showing subdued dynamics, entering a consolidation phase following their previous advance. Earlier, EUR/USD and GBP/USD broke out of their ranges and strengthened; however, the subsequent correction has led both pairs to retest the previously breached