Bitcoin and Ripple showing signs of weakness
BTC/USD
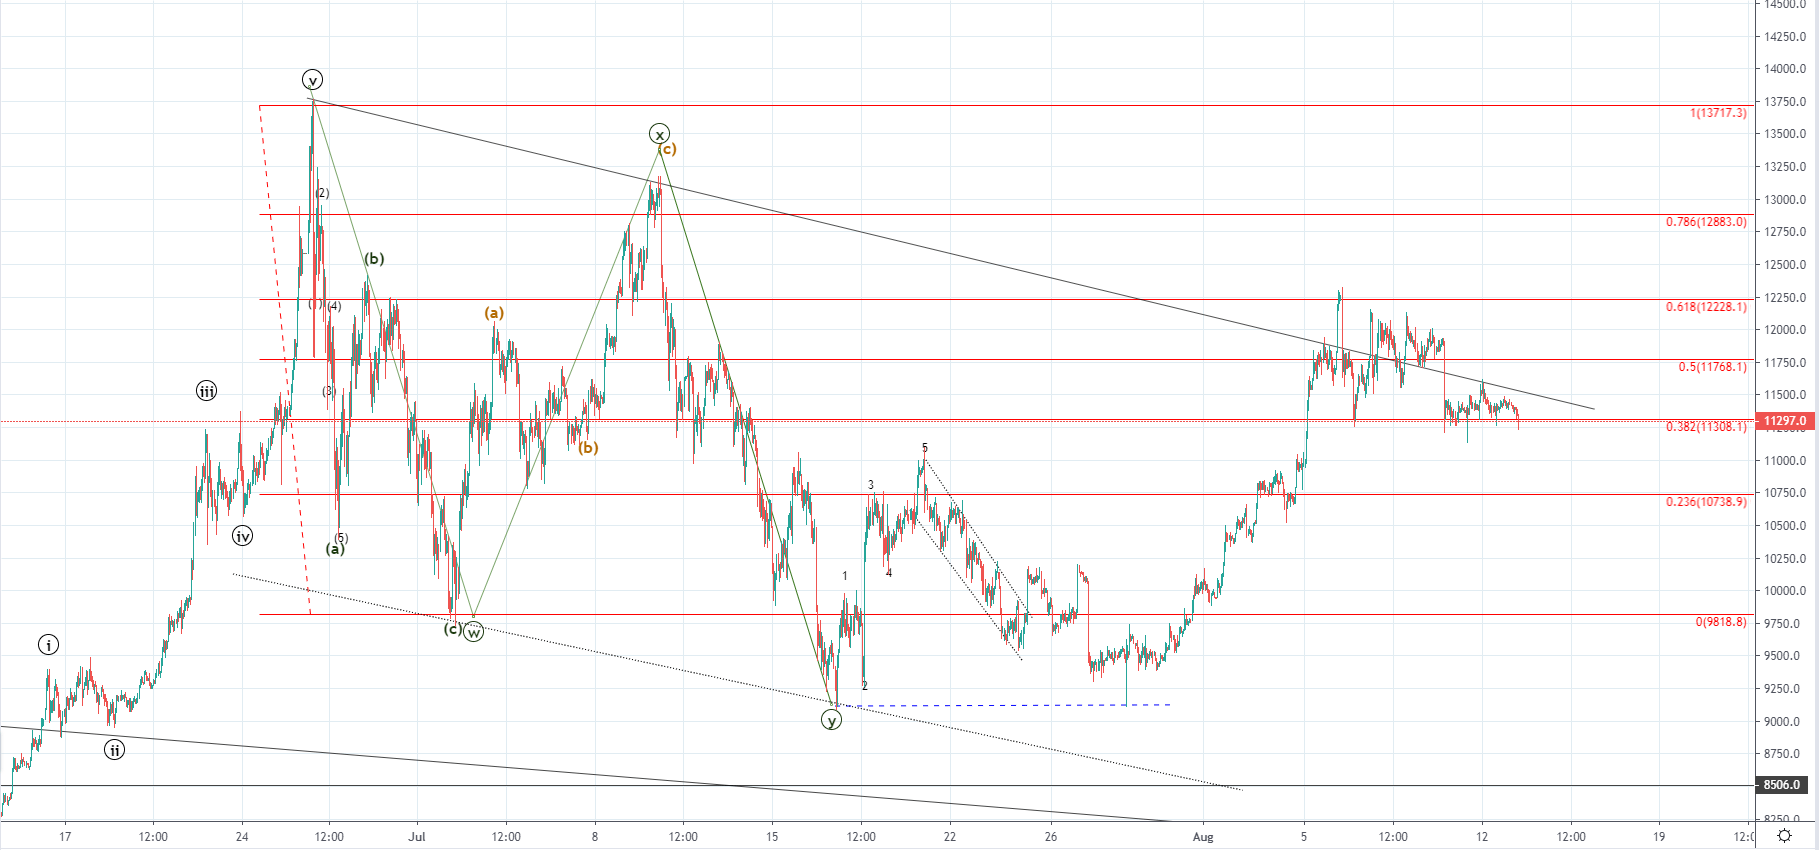
The price of Bitcoin has been decreasing from last Tuesday when it spiked up t0 $12315 at its highest point and came down to $11297 today which is a decrease of slightly over 8%. Last Tuesday’s spike was an interaction with the 0.618 Fibonacci level which ended as rejection with the price currently testing the 0.382 Fib level for support.
That doesn’t mean that after the retracement ends potentially on the next Fib level to the downside at 0.236 we can’t see the uptrend continuation, especially if from 17th of July we are seeing the development of the next five-wave move to the upside as the WXY correction ended. If the price fall below the 0.236 Fib level it would enter the territory of the presumed 2nd wave of a higher degree which would invalidate a possibility of another higher high as we have in that case seen a three-wave corrective upside move.
But if the price finds support at the present levels or starts moving to the downside but manages to stay above $10738 another increase to the 0.786 Fib level would be expected which would be its 5th wave and would indicate further increase as a breakout would occur from the descending channel
XRP/USD
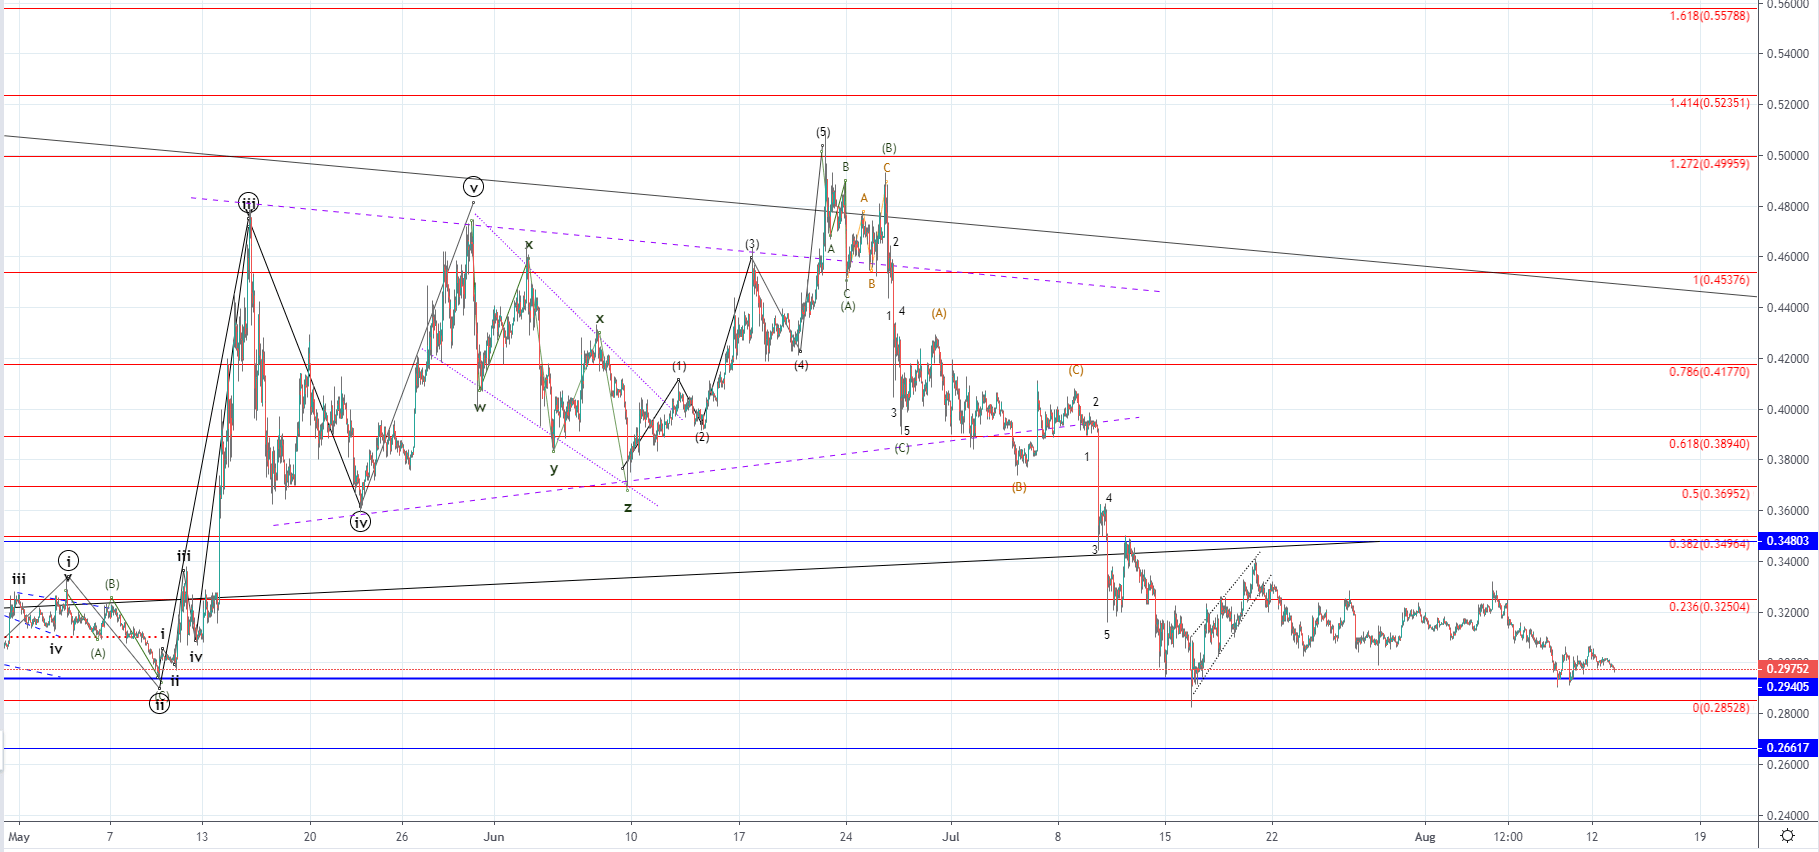
From last Monday till Friday the price of Ripple has decreased by around 12% coming from $0.33141 to $0.2908 at its lowest spike but started recovering over the weekend when it reached $0.3065 on Sunday. Since then the price has been decreasing again as it fell to its most significant horizontal support level at $0.29405 which was retested for support. Currently, the price is being traded slightly higher as the support was there but there haven’t been any signs of interest for the buyer’s side since then as we haven’t seen a strong recovery.
Another possibility would be that the price has reached its key support level from where buying should be initiated but since we haven’t seen significant recovery after the first interaction before a lower high was made and another retest of the level, this isn’t as likely. If the price continues moving below the significant horizontal level the next one which is likely to be interacted with would be at $0.26617.