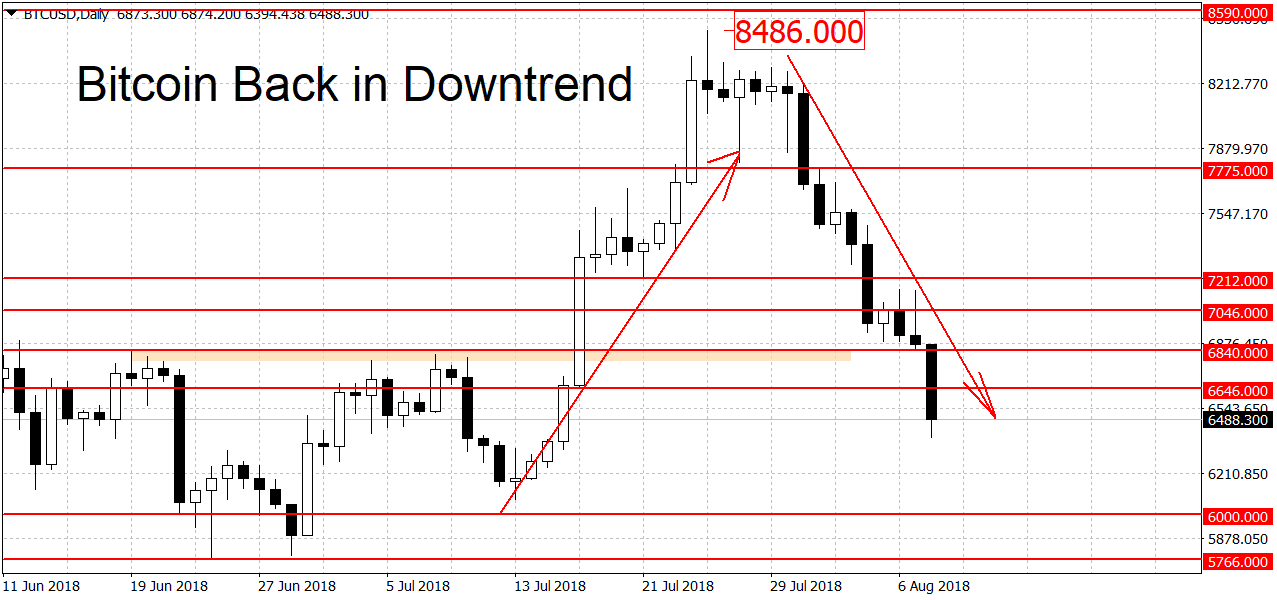
Bitcoin Back in Downtrend
Bitcoin prices are back in a downtrend after falling 10 percent after yesterday’s SEC decision. Litecoin followed suit, breaking out from its range and starting its own bearish trend.
Bitcoin Down After Delayed ETF Decision
Bitcoin prices dropped close to 10 percent in the past 14 hours. The main catalyst behind the news was the U.S. Securities and Exchange Commission delaying a decision on the VanEck-SolidX ETF until September. While this may not seem like such a bad decision, this is exactly how the SEC treated the Winklevoss ETF. That decision was delayed for years, exhausting all legal delay options, then ultimately refused early last year.
Today’s delay comes only 11 days after the SEC rejected the Winklevoss ETF for the second time. As we noted in our article back then, based on the reasons given by the agency, the VanEck-SolidX bid in August should be dead in the water too.
Technically BTC/USD is now back in a downtrend. To end it as well as start a new rally the bulls need a breakout above last month’s high at $8,486 dollars. Below current prices, there’s some support in the $5,766 to $6,000 area. A decisive clearing of this area should open the door to the $5,000 round figure. On the longer-term charts, bitcoin is mixed. The weekly charts are bearish but the monthly is still keeping a slightly bullish bias.
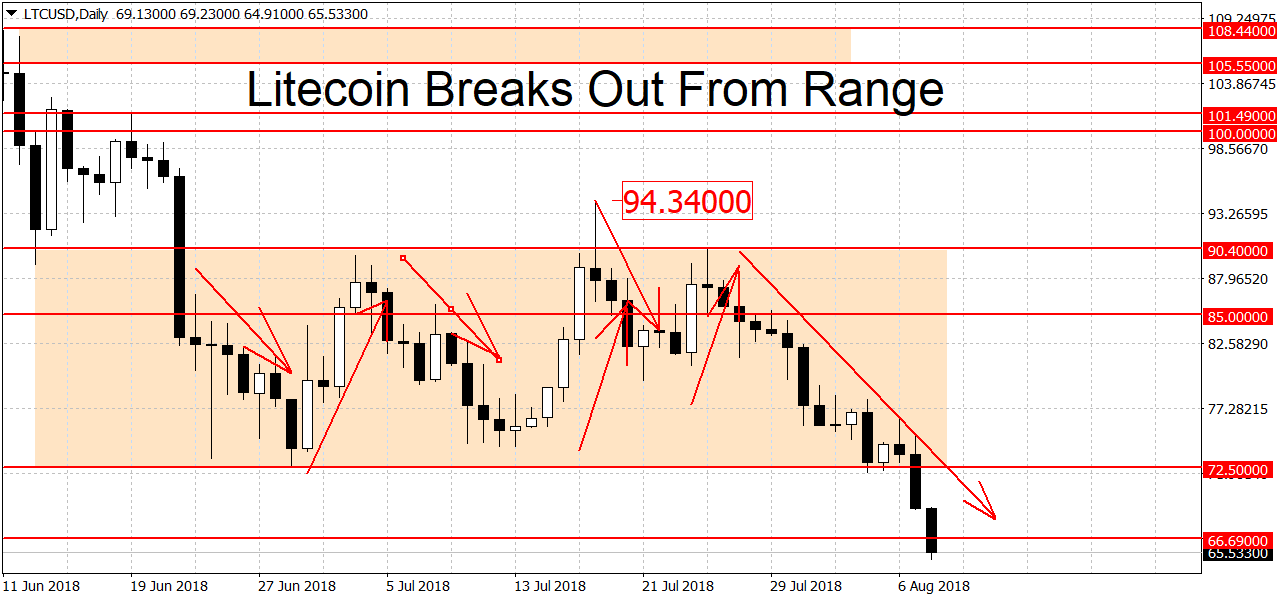
Litecoin Breaks Out of Range
Litecoin finally broke out of its 43-day range. The crypto fell through the $72.50 floor yesterday right as bitcoin was dropping on the ETF news. We are currently trading at $65.53 dollars, down by $8.79 or 11.8 percent.
Similarly to bitcoin, the technical picture in LTC/USD is bearish as well. A breakout above $85 dollars is needed to end the new trend while a move beyond $90.40 could start an uptrend. Below current prices, there’s weak support around $60 and $55 dollars, followed by a much stronger level around $50 dollars per coin.
Here we have the 2013 high at $48.40 dollars coupled with the $50 round figure. That 2013 high wasn’t broken until July of 2017. A clean break below $48.40 could lead to extended losses. On the longer-term charts, the picture is the same as bitcoin, bearish on the weeklies but slightly bullish on the monthly charts.
Trade bitcoin on Forex with FXOpen broker.