


Bitcoin Breaks Resistance, Litecoin Still in Range
FXOpen
Bitcoin broke above the important $380 handle on December 6th, triggering a new BTC rally. So far the gains have been relatively small, $11 dollars or just under 3 percent. It’s little brother Litecoin is still mired in a congestion area, with no end in sight.
Bitcoin Breaks $380 Dollars
Bitcoin broke the important $380 resistance on Sunday. This level was noted in our previous article as the starting point for a new rally. Since then prices have traded higher by $11 dollars or 2.9 percent. We are currently quoted at $391 dollars per coin.
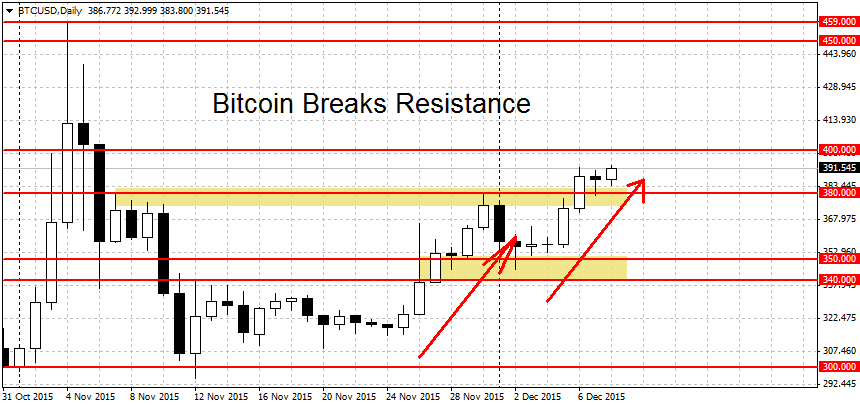
As we can see on the chart above we are slowly inching towards the round $400 figure. Today we broke the December 6th high at $392.33 by 66 cents and set a new monthly high at $392.99. However here prices have stalled somewhat.
On other exchanges, bitcoin has been stuck in a range between $405 and $390 for two days now. The $405 swing high roughly corresponds to $400 at Fxopen. The momentum higher could resume if we get a decisive breakout above this level. Further up more resistance can be found at $450, followed by this year’s high on Fxopen at $459 dollars per coin. The yearly high reached on other exchanges was around $500 dollars per coin, so keep that level in mind as well as potential resistance.
On the lower end the first line of support stands at the $380 breakout point. A move below here should worry the bulls. But the rally will technically remain in place until the $345 swing low is broken.
Litecoin Still Range-bound
Alternative cryptocurrency Litecoin is still stuck in its range. During the past seven days LTC/USD traded between a high at $3.74 and a low at $3.26 dollars. As we can see on the chart below after an initial sell-off Litecoin bounced at the $3.26 support level. Resistance turns to support so it’s not a coincidence to see this former range high support prices on the way down. After the bounce we move higher to $3.51 dollars per coin.
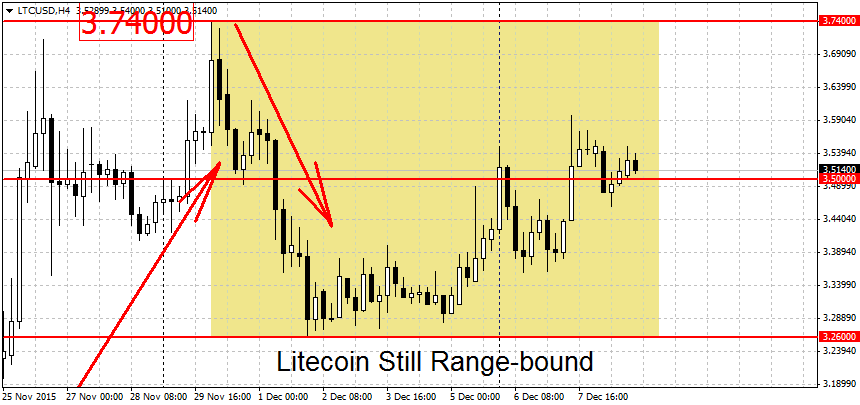
The hurdle to a new LTC rally stands at $3.74 dollars. It seems likely that a continuation of the bitcoin rally above $400 will be needed for this to occur, given how weak Litecoin has been trading lately. Important resistance levels above $3.74 include $4.00 and $4.50 dollars, followed by the November high for Litecoin at $4.85.
On the lower end the figure to watch is the round $3 dollars level. A breakdown below here would start a new downtrend. Important support levels below include the $2.88 swing low, followed by $2.70 and $2.50 dollars per coin. The January swing high at $2.40 dollars is another potential support for LTC/USD.
FXOpen offers the world's most popular cryptocurrency CFDs*, including Bitcoin and Ethereum. Floating spreads, 1:2 leverage — at your service (additional fees may apply). Open your trading account now or learn more about crypto CFD trading with FXOpen.
*Important: At FXOpen UK, Cryptocurrency trading via CFDs is only available to our Professional clients. They are not available for trading by Retail clients. To find out more information about how this may affect you, please get in touch with our team.
This article represents the opinion of the Companies operating under the FXOpen brand only. It is not to be construed as an offer, solicitation, or recommendation with respect to products and services provided by the Companies operating under the FXOpen brand, nor is it to be considered financial advice.
Stay ahead of the market!
Subscribe now to our mailing list and receive the latest market news and insights delivered directly to your inbox.


Latest articles

Pound at Key Levels: Markets Assess Impact of Political Uncertainty in the UK
The British pound remains under pressure following increased political uncertainty in the United Kingdom triggered by the Prime Minister’s resignation. Investors are assessing potential shifts in the political and economic policy outlook after the head of government stepped down,

Silver: Fed Tightens Its Tone as Price Returns to the Volume Profile Zone
Silver came under pressure following the Federal Reserve’s June meeting, at which policymakers kept interest rates unchanged at 3.50–3.75%. Nine of the 18 committee members still see the possibility of a rate increase this year, reinforcing

Ethereum: Market Assesses the Strength of the Corrective Recovery
Following a period of heightened volatility in early June, investor attention in Ethereum has once again shifted towards institutional demand and the development of the spot ETF market in the United States. The funds launched last year continue to serve