Bitcoin bulls target $8500 and $9000, Ripple spikes up by 29%
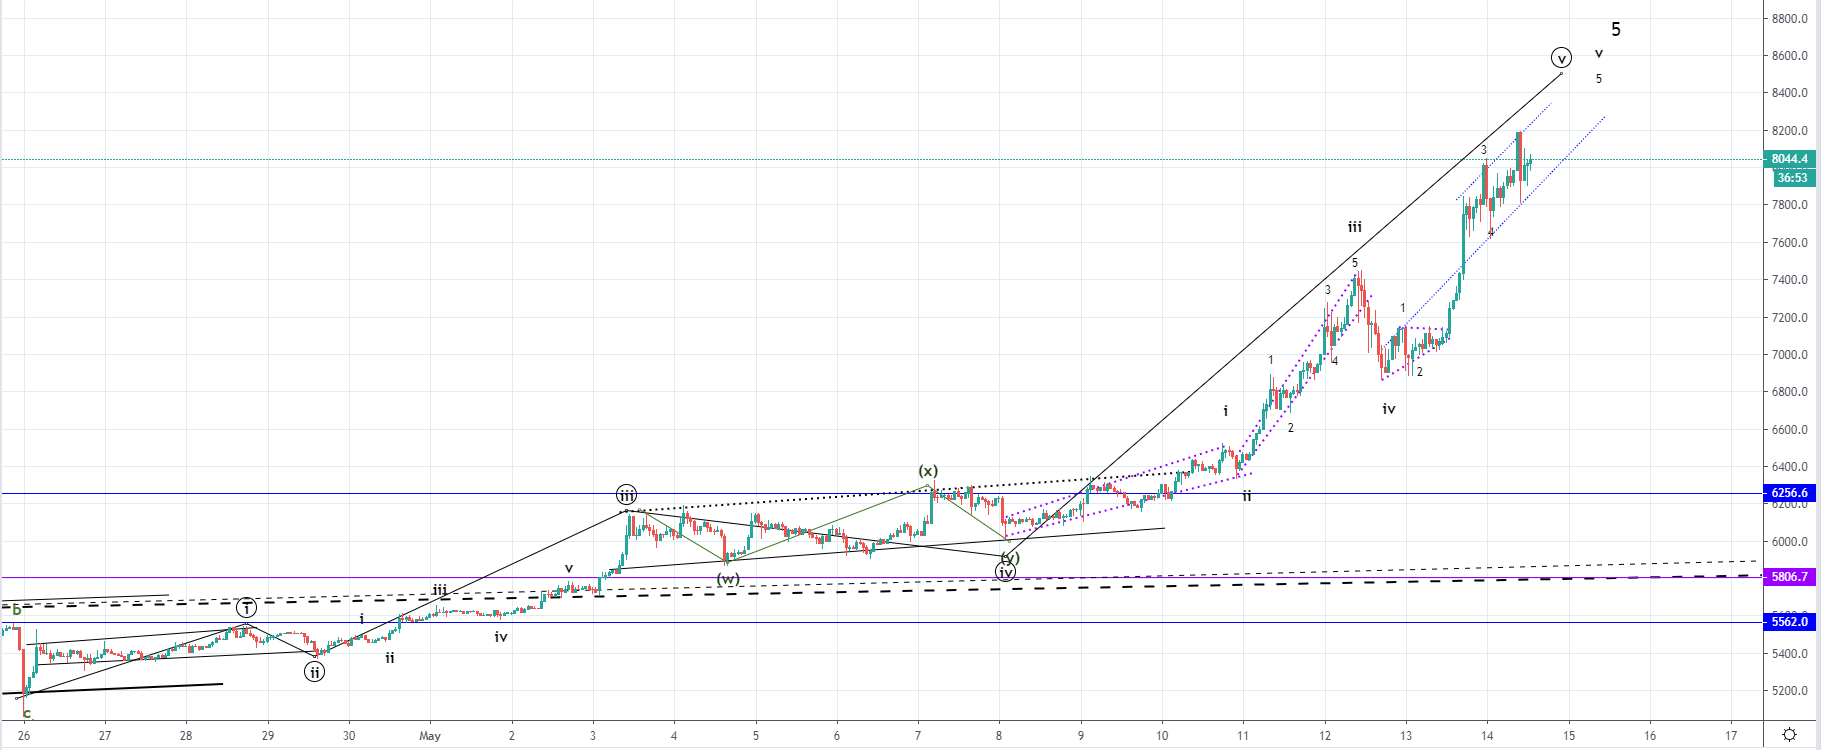
BTC/USD
The price of Bitcoin has continued increasing over the weekend and has come up from $6225 on Friday’s low to $8166 at its highest point today which is an increase of 31.5%. This increase is a continuation of the impulsive move started on the 26th of April and is the ending wave of the higher degree count.
The price broke the significant resistance level at around $6250 which is highly significant as it was the major support point on the way down. This could indicate the start of the bull market and considering the momentum behind the upward movement, this could be likely.
We are seeing the 5th wave off of the five-wave impulse of the Minute count near completion but there is still more room to the upside before it ends. The price action has started forming an ascending channel from yesterday which is why more upside would be expected from here but since this would be the end of the higher degree 5th wave as well, a higher degree downturn would be expected shortly.
From this downturn, we are to reevaluate the possibility of the starting bull market as from its momentum and depth will depend the primary count. For now, we are seeing the three wave upswing from 15th of December which could still end as a correction, so now as the price broke significant resitance point it needs to stay above. If the price holds above the $6250 level on the retracement it would mean that we have seen the 4th wave with another increase incoming which will confirm the possible bear market bottom and the start of the bull market but if the price goes below it and enters the territory of the ascending channel we could see further downside with lower lows.
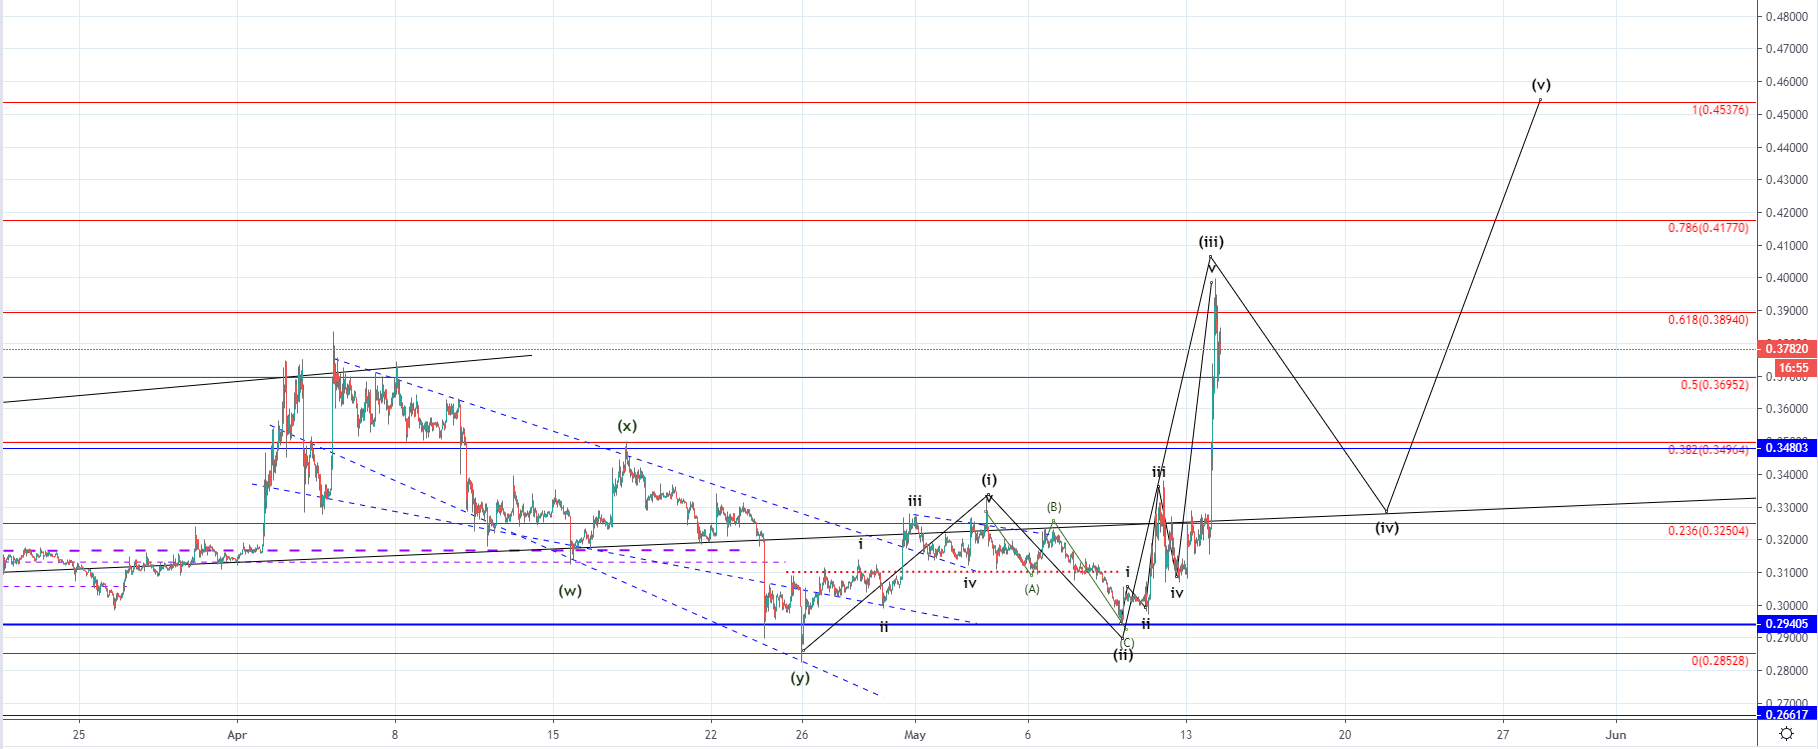
XRP/USD
The price of Ripple has increased by 29% from yesterday’s low at $0.3106 to today’s highest point at $0.40066. As the price spiked to the upside quickly a pullback has been made with the price currently being traded at around $0.3783 level.
Looking at the hourly chart, we can see that the price came up above the significant ascending trendline which is the baseline support dating from August 2017 and is the most important trendline which was never broken until recently on 24th of April when the price came below it but found support on the significant horizontal level at $0.29405. As the interaction with the horizontal support level was made twice and the price found support, an impulsive move to the upside started.
This is most likely the 3rd wave from the five-wave impulse wave as the first one began after the first interaction with the mentioned significant horizontal level and the second interaction which further established support was its 2nd. If this is true then now after the third wave most likely ended around the 0.618 Fibonacci level a retracement would be expected. The most optimal scenario would be that the price comes back to the ascending level (baseline support) from a retest of support and finds support there before continuing its bullish momentum.
If the price goes below it, it would invalidate the count as the price would enter the territory of the presumed 2nd wave which it cannot do on the 4th. As prior to the upside move we’ve seen a correctional descending structure which pushed the price below the significant support, the price has likely started an attempt to move back up above its mean line.