Bitcoin decreased by 4%, Litecoin lost 7% in a week
BTC/USD
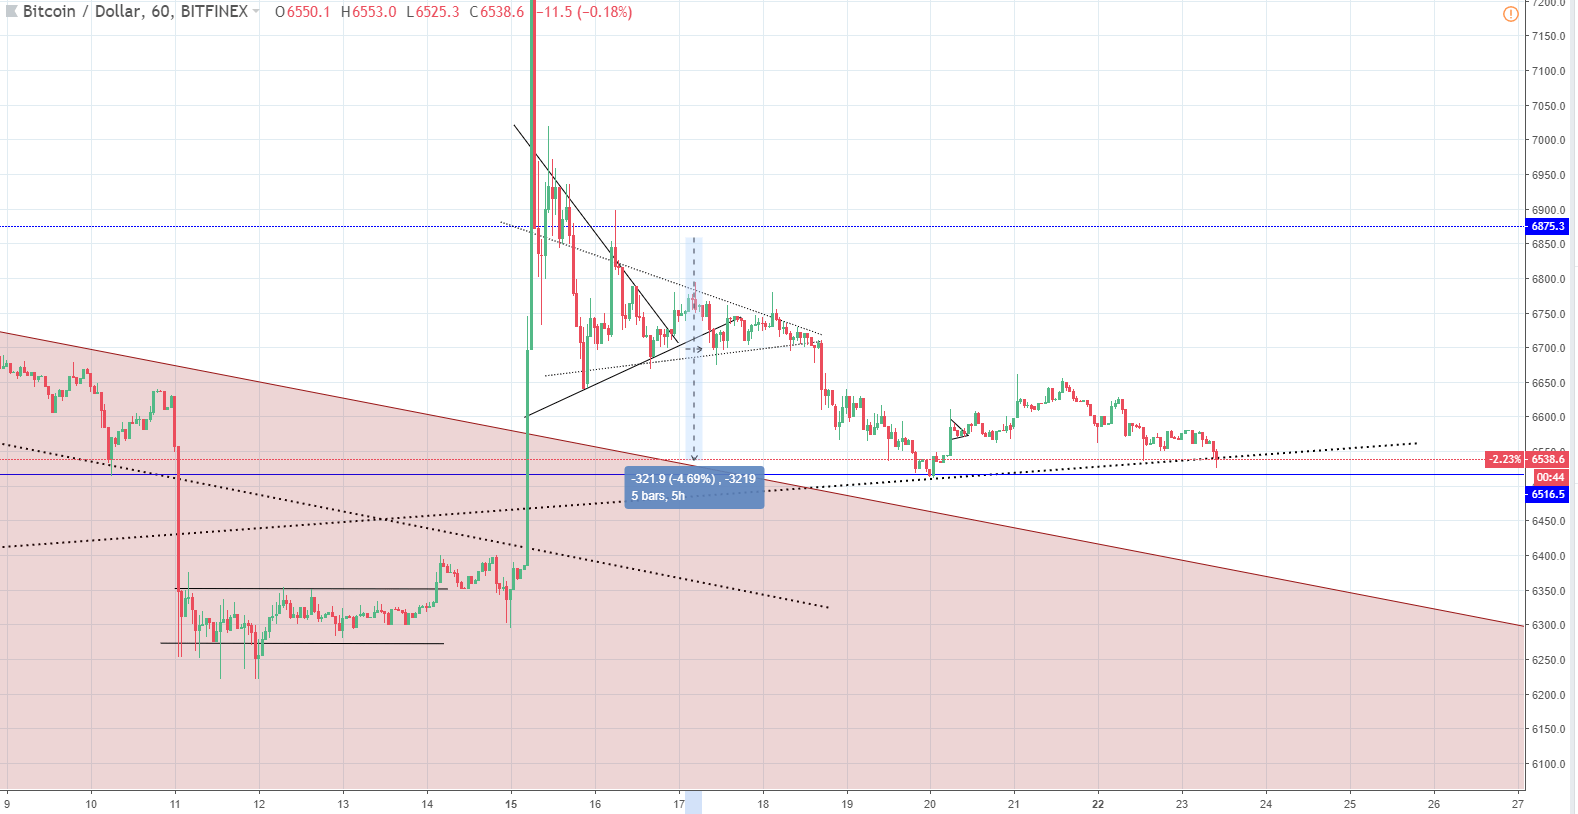
From last Tuesday, October 16th, the price of Bitcoin has decreased by 4.69% from the high at $6852 to the current levels of $6535.
Looking at the hourly chart, we can see that the price action has broken out off of the minor symmetrical triangle. It was formed after a Bull flag, making it invalid and signaling that the price is likely heading down, which is what happened. After a breakout, the price fell to the next significant level it found in a lookout for support. It is on the prior higher degree symmetrical triangle inside a descending one from which the price broke out last Monday.
As you can see, the intersection between that level and the horizontal support level served as a temporary support. The price bounced off of it but as the peak was only to $6655 more downside was to be expected. Currently, the price has fallen again and is now interacting with the symmetrical triangle of a higher degree support. The price quickly dipped below it but jumped above it again leaving a wick on the hourly chart.
Price action has made a higher low for now indicating potentially a higher high on the next wave up. It would have to be higher than $6655 but as the next hourly candle opened below the symmetrical triangle’s support, I am rather expecting more downfall from here, at first to the horizontal support and then further down to the descending triangle’s resistance (red triangle) and all of this on a couple of red candles.
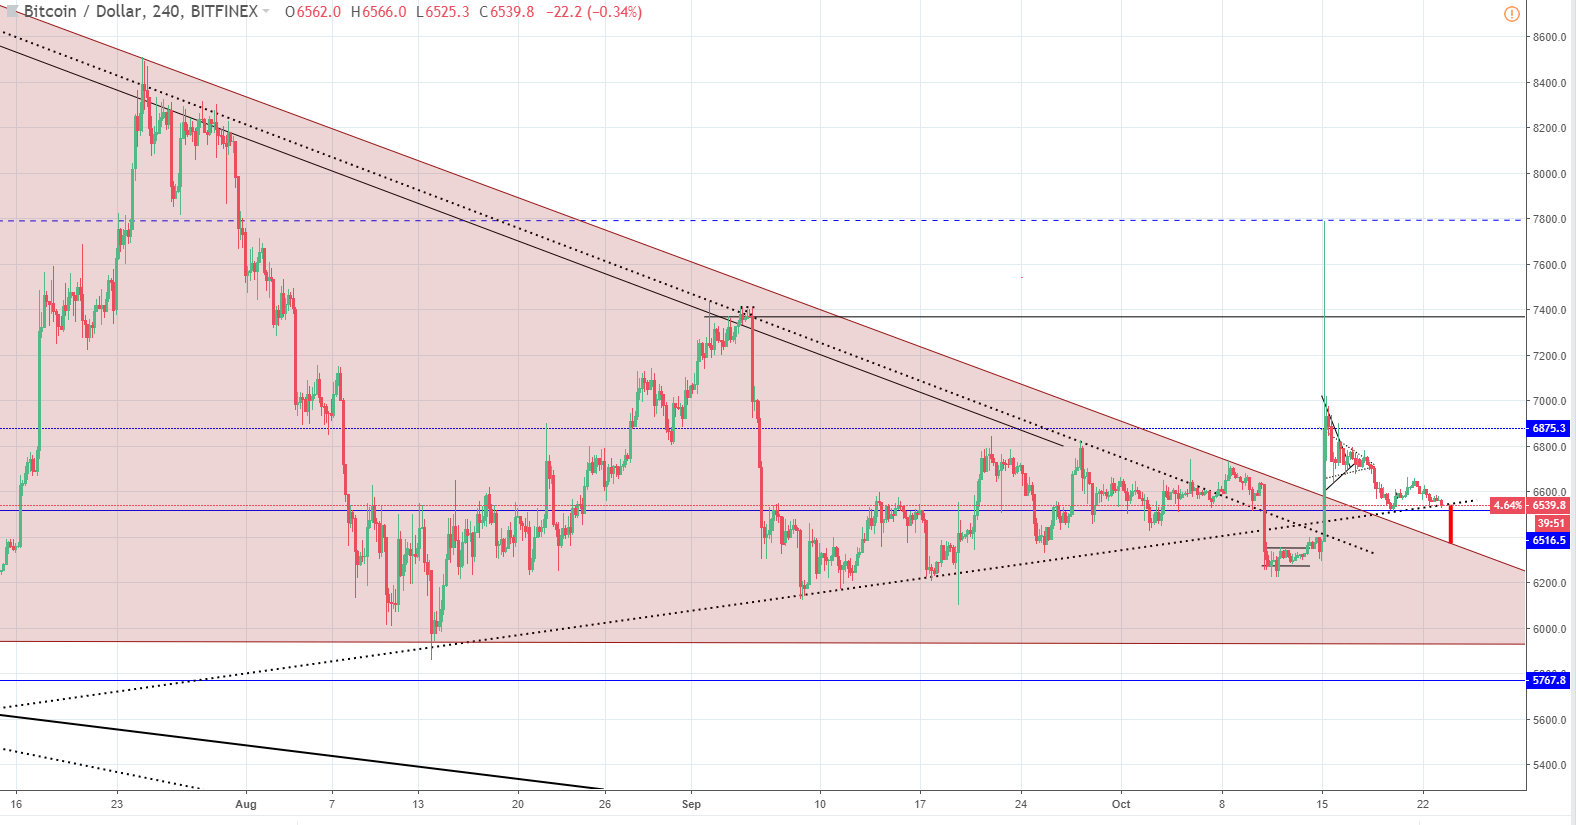
Zooming out to the 4-hour chart you can see the referred “higher degree symmetrical triangle” on which support line the price is currently interacting with.
As you can see, the price at first broke it from the downside on October 11th. Then a lower leg cluster was formed. I was expecting another downward move after but the price spiked up significantly due to the Tether FUD. Now, as the fundamental reasoning behind the spike proved not to be a real demand, investors are slowly losing confidence again. That is why I would expect the price falls from here steeply as it came up.
LTC/USD
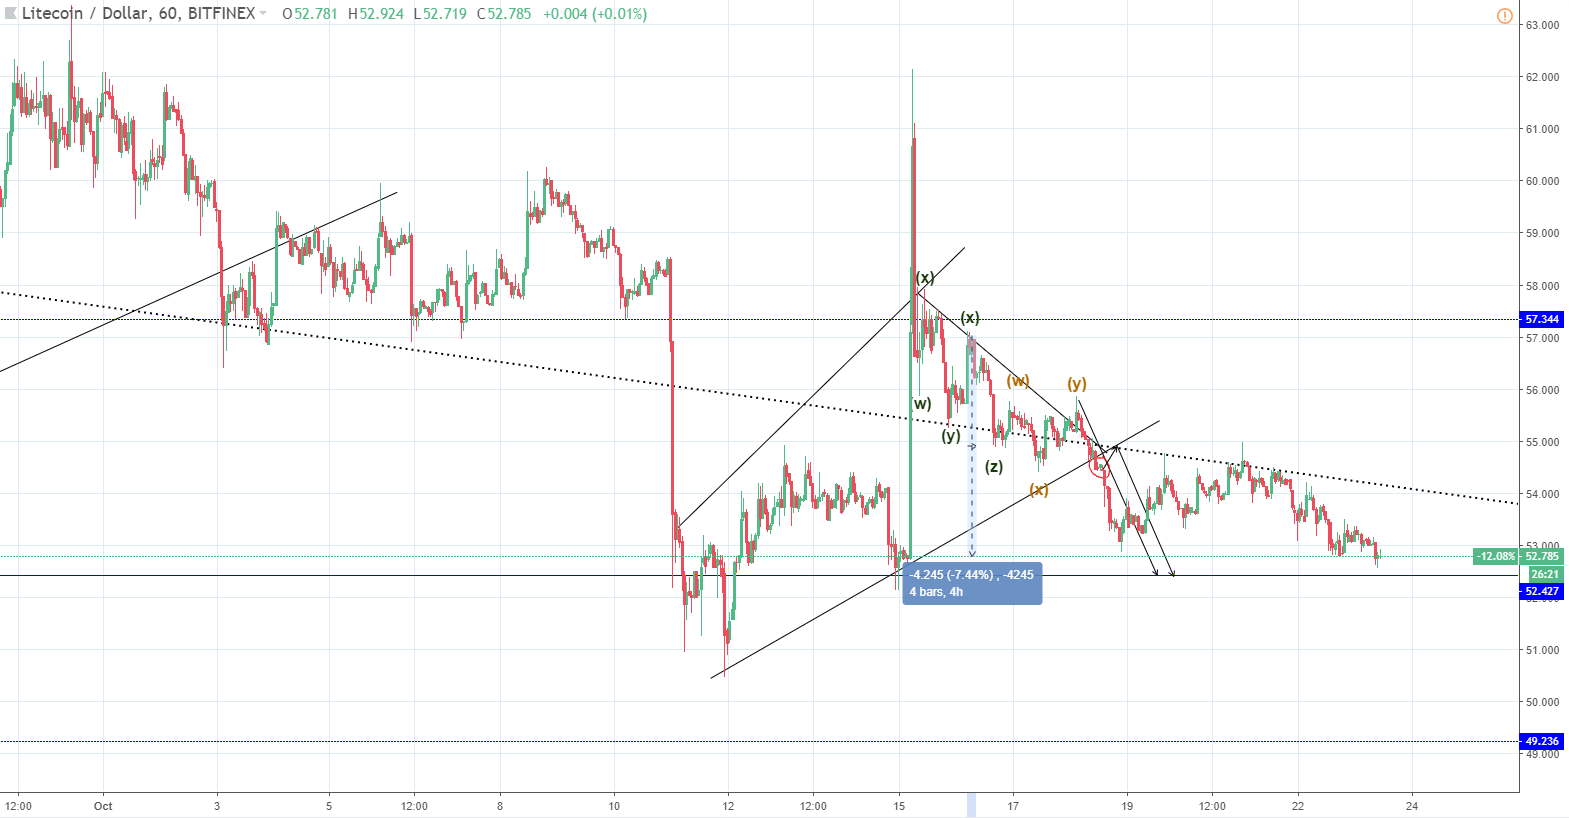
The price of Litecoin has fallen by 7.44%, coming from $57 to the current levels of $52.8 from last Tuesday.
As you can see from the hourly chart, the price is getting really close to my expected target, which was projected after the second minuette wxy in the opposite direction formed. The target is the horizontal support level, which can be clearly seen on the 4-hour chart. After the price broke down below the descending channel resistance it went up to retest it and the interaction ended as a rejection. Hence, the price fell a bit lower on this run down.
Currently the price looks like it found some temporary support on the minor range judging by the wicks that have started to form. But you can also see that the price already interacted with these levels couple of hours ago meaning that a minor double bottom has formed. This temporary support may cause the price to recover in the short-term. But I would be suppressed if that recovery ends pushing the price beyond the descending channel resistance line again. It is more likely that the price heads further down from here for a proper interaction with the horizontal significant level at $52.43 and then goes further down below it.
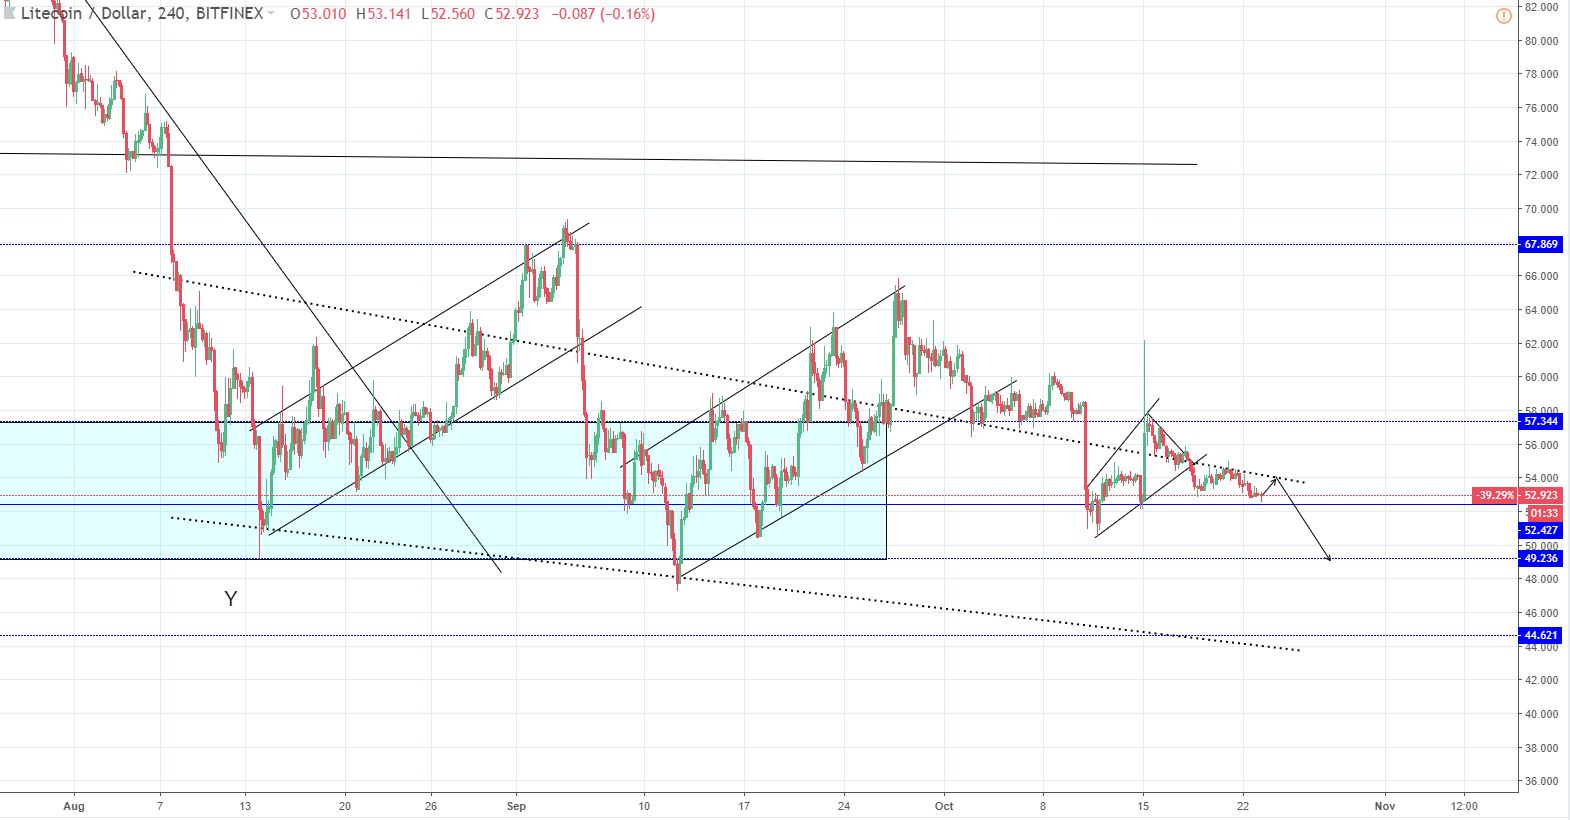
Looking at the 4 hour chart you can see that the price action formed three consecutive ascending channels. It is an attempt to breakout from the bigger descending one where the price is from 14th of August. Now the price is below its resistance again. I am expecting it to go to the $49.23 level, which is S1 from the support zone range.
We might see an increase beforehand to retest the channels resistance once again, but that might not happen as the price has already done it. Looking at the wave structure it seems the retest was the second corrective wave and this current down move is the third most powerful one. You can also see that the horizontal significant level awaits interaction in the midpoint of the support range. Even if the price is to breakout from the upside and goes in an upward trajectory, it will have to test the support level first in the upcoming period.
Try BTC trading on FXOpen Crypto accounts.