


FXOpen
Both bitcoin and litecoin entered downtrends last week. Bitcoin took out the important $250 handle, while Litecoin broke below the low of its range at $3.70. Consequently BTC/USD fell by over 22 percent while the losses in LTC/USD exceeded 30 percent.
Bitcoin Down by 22 Percent
During the last 7 days, everyone’s favorite cryptocurrency fell by almost $58 dollars to a low of $192.55 today. We already reported on the Wednesday crash in our last article. But the BTC losses didn’t stop there. Since last Thursday, bitcoin lost a further $41 dollars (from $233 to $192). We are currently experiencing a slight retracement with BTC/USD trading at $210 dollars per coin.
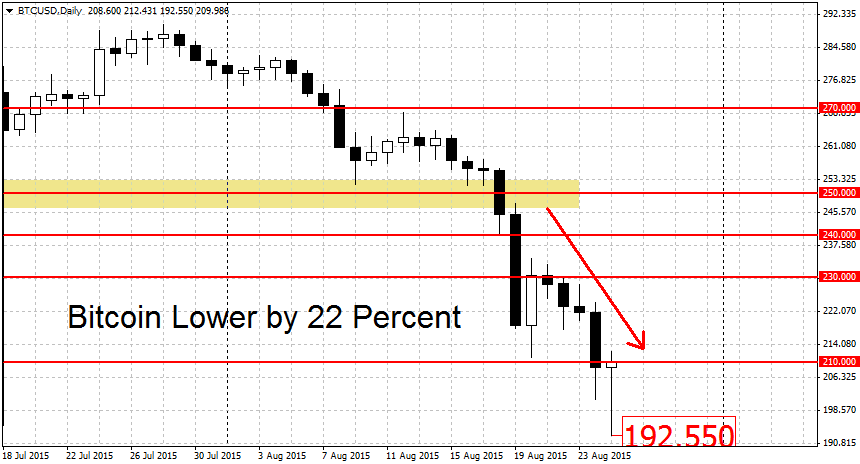
This is an important resistance level for bitcoin. It was a previous double bottom formation that remained unbroken for several months. This month it managed to hold up the decline by several days, thus reaffirming its validity. Support turns to resistance and $210 may become relevant again, this time as a lid on rising prices.
Higher up, a weaker resistance level can be found at $230. This is followed by a major resistance at $250 dollars. This was the starting point for the current BTC rally. Higher still, a break above $260 dollars per coin should end the downtrend.
On the lower end we find a weak support at the $200 round figure. It’s debatable if this is even a valid support figure since it failed to act as either support or resistance in the last two days. Further downward, the $192.55 swing low is another potential support level. But the major figure for BTC/USD will be this year’s low at $162 dollars. A break below here could see the losses accelerate.
Litecoin Falls 30 Percent After Breakdown
Alternative cryptocurrency Litecoin fell by over 30 percent since our last LTC update. Back then we noted that LTC/USD is stuck in a tight range between $3.70 and $5.06. On Wednesday the $3.70 handle finally broke, opening the door to more losses. By week’s end litecoin was down to $3.17 dollars and in the last two days we saw renewed selling take prices to $2.5050.
Note that the $3.17 low is very close to our stated important support of $3.18 in our article. This is a former swing high that held up the rally in June for several days. It’s validity was confirmed in July when prices rebounded at $3.1840 in the aftermath of the crash. Litecoin is currently enjoying a limited bounce to $2.67.

With the crypto now firmly in a downtrend, more losses may be on the way. However keep in mind that we are currently down by 28 percent from the breakout point, which is not a small amount. Support on the way down can be found at $2.50, followed by $2.40 and $2.05 dollars per coin. One the upside we find resistance at $3 dollars, followed by $3.18, $3.43 and $3.50.
FXOpen offers the world's most popular cryptocurrency CFDs*, including Bitcoin and Ethereum. Floating spreads, 1:2 leverage — at your service. Open your trading account now or learn more about crypto CFD trading with FXOpen.
*At FXOpen UK and FXOpen AU, Cryptocurrency CFDs are only available for trading by those clients categorised as Professional clients under FCA Rules and Professional clients under ASIC Rules respectively. They are not available for trading by Retail clients.
This article represents the opinion of the Companies operating under the FXOpen brand only. It is not to be construed as an offer, solicitation, or recommendation with respect to products and services provided by the Companies operating under the FXOpen brand, nor is it to be considered financial advice.
Latest from Cryptocurrencies
Latest articles

Is There the Best Time to Trade Stock CFDs?
If you ask experienced traders, many will say that they trade on certain days or at certain times of the day. Their choice is determined by the market dynamics, volatility, and liquidity. It’s crucial to understand when the best

UnitedHealth (UNH) Share Price Surges after Strong Report
UnitedHealth shares surged Tuesday, rising more than 5% after the health care giant delivered stronger-than-expected first-quarter 2024 results:
→ earnings per share: actual = USD 6.91, expected = USD 6.61, last quarter = USD 6.16;
→ gross income: actual = USD 94.4

USD/JPY Analysis: Prospect of a Breakout of the Level of 155 Yen per Dollar
The USD/JPY rate has consistently reached new highs since 1990, approaching the psychological level of 155 yen per US dollar. The Japanese currency has already fallen about 9% against the dollar this year.
This is supported by Jerome Powell,