


Bitcoin Drops, Litecoin Follows
FXOpen
Yesterday bitcoin made another attempt to break out and end the current downtrend. It was unsuccessful and the coin proceeded to drop by $346 dollars from the highs. Litecoin followed big brother lower declining by 6 percent today.
Bitcoin Drops From Highs
Bitcoin hit a high of $6,806 yesterday, only $34 dollars away from the previous swing high at $6,840 dollars. As noted in our last article, we needed a breakout above this level to end the downtrend. As that didn’t occur, BTC/USD remains in a downtrend on the daily charts.
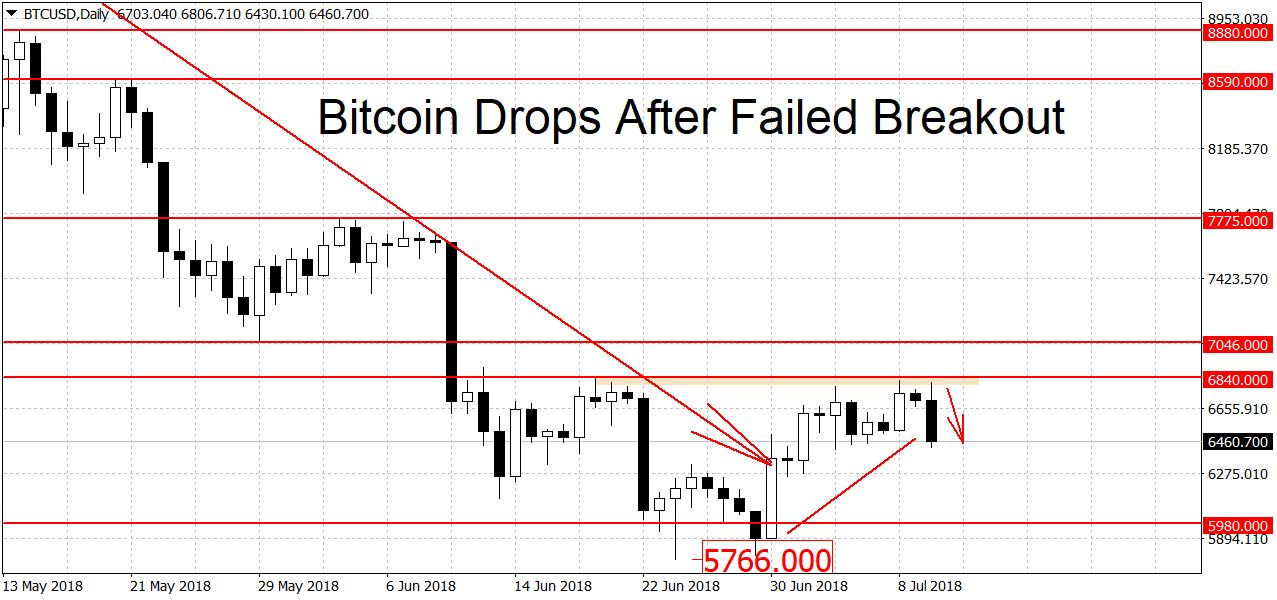
The $6,840 dollars figure remains to be the important swing high. A breakout above it would both end the downtrend and trigger a new uptrend in prices. We are currently quoted at $6,460 dollars, down 3.6 percent on the day.
Below there’s some support at this year’s low of $5,766 dollars. A stronger level however can be found at the $5,000 round figure. Besides being a major round figure, $5,000 was also a notable swing high last year that stalled the bubble by one month. It’s unlikely that this support will be broken on the first try. When and if $5,000 breaks the losses could intensify.
On the upside there’s strong resistance at $6,840 dollars followed by a weaker level at the previous swing low of $7,046 dollars. Resistance higher up can be found at the $7,775 swing high. This is followed by more levels at $8,590 and 8,880 dollars. The $10,000 round figure is another notable resistance level. A breakout above could lead to more gains. There’s no change in trend on the longer-term charts, the weeklies are in a downtrend while the monthlies are still looking bullish.
Litecoin Follows BTC Lower
As usual litecoin, as most of the crypto market, followed BTC lower. The crypto is trading at $76.20 dollars at the moment, down by $4.80 today or around 6 percent.
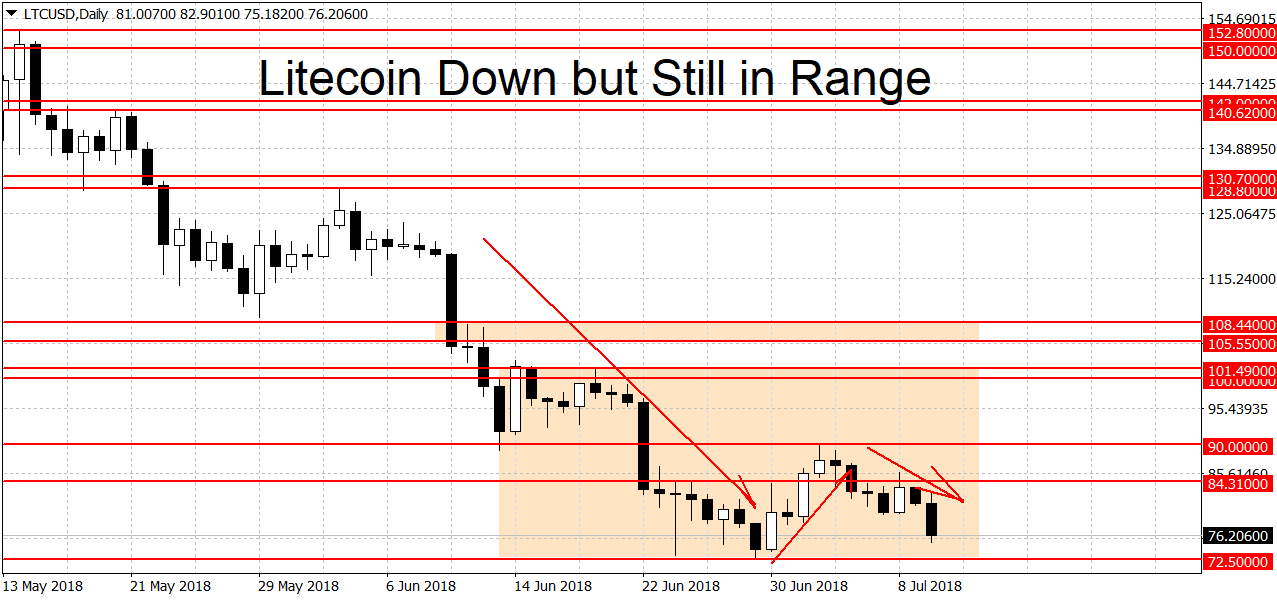
Despite the losses LTC/USD remains in a range as you can see on the chart below. We need a breakout above $101.49 or below $72.50 to start a new trend. As things stand right now a break to the downside is more likely. Below $72.50 the next major level of support is around $50 dollars. Here we have the 2013 high at $48.40 dollars coupled with the $50 round figure. A clean break below $48.40 could lead to more losses below. This doesn’t mean that the ‘coast is clear’ for shorts between $72.50 and $50 dollars as some support is likely to emerge in this 30 percent gap.
On the upside after $101.49 there’s strong resistance in the $105 – $109 area. This was the low in 2018 for over five months until the June breakdown. A clearing of this resistance area could lead to more gains. On the longer-term charts litecoin is bearish on the weeklies but bullish on the monthlies.
MetaTrader BTC trading on FXOpen Crypto accounts.
FXOpen offers the world's most popular cryptocurrency CFDs*, including Bitcoin and Ethereum. Floating spreads, 1:2 leverage — at your service (additional fees may apply). Open your trading account now or learn more about crypto CFD trading with FXOpen.
*Important: At FXOpen UK, Cryptocurrency trading via CFDs is only available to our Professional clients. They are not available for trading by Retail clients. To find out more information about how this may affect you, please get in touch with our team.
This article represents the opinion of the Companies operating under the FXOpen brand only. It is not to be construed as an offer, solicitation, or recommendation with respect to products and services provided by the Companies operating under the FXOpen brand, nor is it to be considered financial advice.
Stay ahead of the market!
Subscribe now to our mailing list and receive the latest market news and insights delivered directly to your inbox.


Latest articles

Apple: Earnings Day Above the Activity Zone
On 30 April, after the market close, Apple Inc. will release its financial results for the second quarter of fiscal 2026. The consensus forecast, based on estimates from 31 analysts, points to revenue of around $109.7 billion, with expected

USD/JPY and USD/CHF Near Key Levels: The Dollar Supported by the Fed
The US dollar continues to trend upwards following the Federal Reserve meeting, drawing support from the regulator’s moderately hawkish stance and comments by Jerome Powell. Markets interpret the Fed’s rhetoric as a signal that restrictive policy is likely

EUR/USD and GBP/USD consolidate ahead of the Fed decision
European currencies are showing subdued dynamics, entering a consolidation phase following their previous advance. Earlier, EUR/USD and GBP/USD broke out of their ranges and strengthened; however, the subsequent correction has led both pairs to retest the previously breached