Bitcoin Forks, Prices Drop
The long-anticipated bitcoin fork finally happened today. Prices first rallied going into the event only to drop few hours before the split. Alts followed a reverse pattern with losses pre-fork and large gains shortly after.
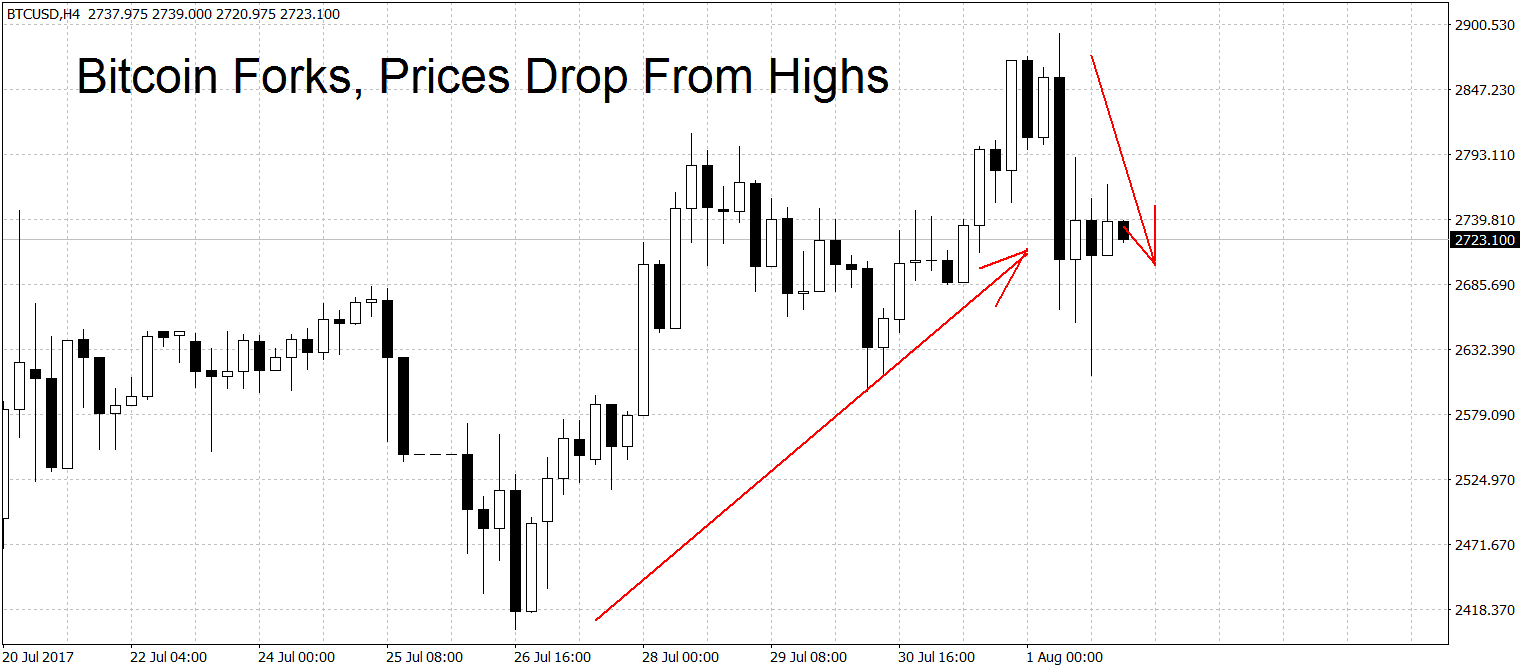
Bitcoin Forks, Prices Drop From Highs
Bitcoin prices hit a high of $2,892 on FXOpen today just hours before the BCC hard fork. Soon after, however, we saw a large crash of over $200 in less than four hours.
Before we go let’s recap what’s going on here for our newer readers. A UAHF (User Activated Hard Fork) called bitcoin cash launched on August 1st. The code is mostly the same as the current bitcoin, with an added blocksize increase to 8 MB. Exchange VIABTC (and others) now allow trading of Bitcoin Cash (BCC).
It is rumored that BCC is a ‘backup bitcoin’ for some Chinese miners who fear that the 2 MB hard fork part of the Segwit2x code won’t be honored 3 months down the line. More on the technical details about Segwit2x HERE. More on bitcoin cash and the future implications for BTC holders HERE.
Now let’s get back to the charts! It appears that the size of the drop was similar to the ‘dividend’ in the form of free BCC for every BTC holder. Before the fork, bitcoin cash (BCC) was trading at 1 to 10 ratio to regular BTC, implying a value of close to $290 dollars at the highs.
Technically we’re still in an uptrend on the daily charts. To end it the bears will have to push us below the $2,400 swing low. A new downtrend, however, requires a breakdown below the July lows at $1,812 dollars. On the long-term charts, BTC/USD is also in an uptrend.
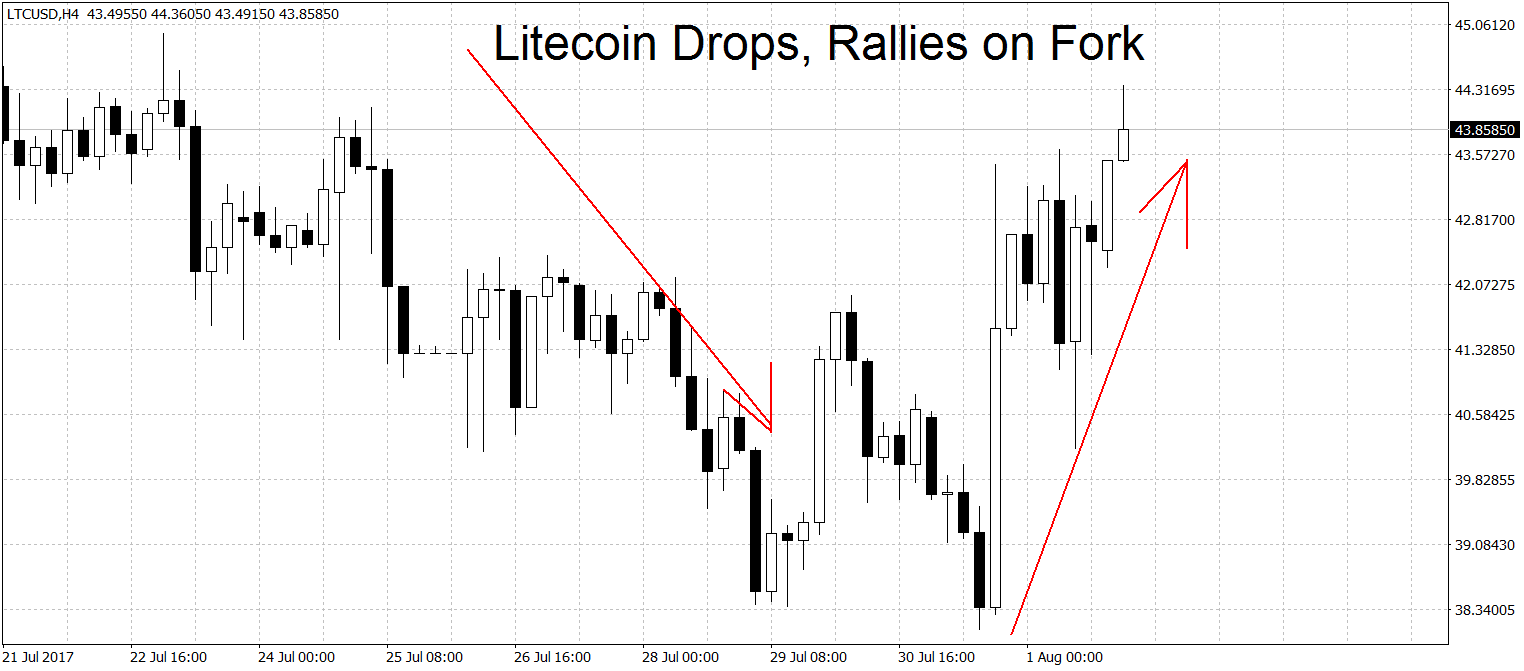
Litecoin Drops, Rallies After Fork
Litecoin prices fell to a low of $38.11 on July 31st as alts got sold across the board to get BTC and thereby free BCC. With the appearance of the LTC creator Charlie Lee on CNBC, we hit a floor in the litecoin rate about day earlier than most altcoins. Prices spiked on July 31st after the interview to $43 dollars per coin and have stayed there ever since.
Litecoin remains in a range on the daily charts. A new rally requires a break above $46.70 dollars while a new downtrend needs a move below the $35.45 swing lows. On the longer-term weekly and monthly charts, LTC/USD is still looking bullish.