


Bitcoin Higher, Litecoin Little Changed
FXOpen
Bitcoin is trading higher while Litecoin is little changed. This is a repeat of what has become a familiar pattern during the past few weeks. One bitcoin is now selling for $735 dollars, up 5.5 percent since our last update. Litecoin is quoted at $3.92. This is higher by 2.6 percent but well below any important resistance levels.
Bitcoin Up 5.5 Percent
It’s another week of gains for BTC/USD. We’re now up by 5.5 percent compared to last Tuesday and close to 20 percent since the start of this rally back in October.
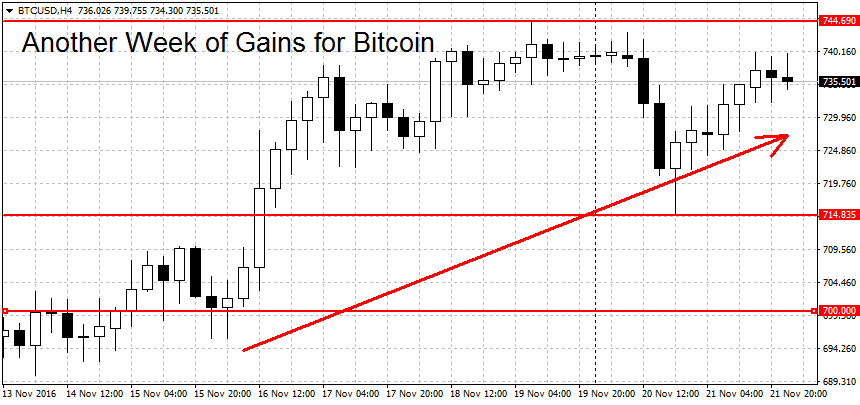
Although we haven’t seen any sizable gains during the past five days, the uptrend is still in place. To end it, the bears will have to push prices back below the $685 swing low on FXOpen. This corresponds to around $683 dollars per coin on other exchanges. A break of the spike low at $671 is needed to start a new downtrend.
On the other end, we have this month’s high at $744.69, slightly above the yearly high at $744.39. This forms a double-top pattern. A decisive break above here may lead to more gains. However, some caution is advised. For one, on other exchanges these levels are different. On BitStamp for example, we topped out this month at $755 but this year’s high was way above here at $778. The second point of caution would be length of the current rally. We’re now one-and-half months into this uptrend. If history is any guide, new entrants would be coming late to the party.
Litecoin Little Changed
Another range-bound week for bitcoin’s little brother LTC. While the altcoin is up 2.6 percent since last Tuesday, no clear momentum can be seen on the chart below.
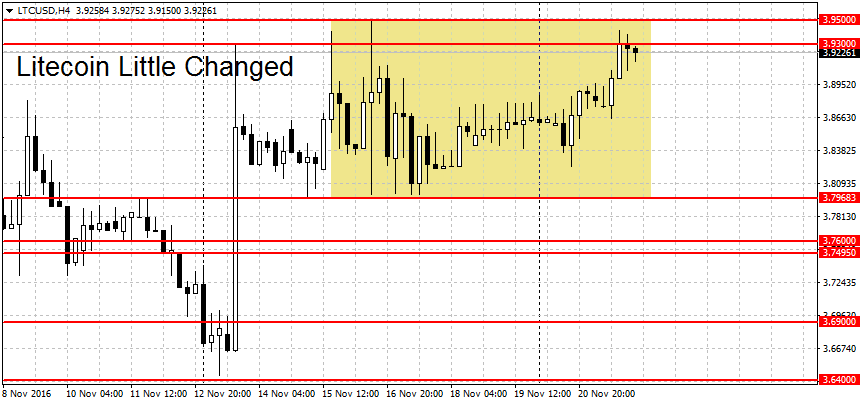
We are well below the crucial resistance level at $4.08 and well above the important support near $3.64. No trend will emerge until the altcoin decides to break above/below these points. Litecoin is range-bound on the weekly and monthly charts as well.
Below $3.64 we have support at the $3.50 round figure followed by the $3.22 swing low. Further down we have more levels at the $3 round figure, the $2.89 swing low and the last August lows near $2.50 dollars per coin. Above $4.08, more levels can be found at $4.15, followed by a resistance area from $4.43 to $4.52 per coin. A clearing of this area could extend the rally.
FXOpen offers the world's most popular cryptocurrency CFDs*, including Bitcoin and Ethereum. Floating spreads, 1:2 leverage — at your service (additional fees may apply). Open your trading account now or learn more about crypto CFD trading with FXOpen.
*Important: At FXOpen UK, Cryptocurrency trading via CFDs is only available to our Professional clients. They are not available for trading by Retail clients. To find out more information about how this may affect you, please get in touch with our team.
This article represents the opinion of the Companies operating under the FXOpen brand only. It is not to be construed as an offer, solicitation, or recommendation with respect to products and services provided by the Companies operating under the FXOpen brand, nor is it to be considered financial advice.
Stay ahead of the market!
Subscribe now to our mailing list and receive the latest market news and insights delivered directly to your inbox.


Latest articles

EUR/USD Eyes Gains As USD/CHF Weakness Deepens Again
EUR/USD started a fresh increase above 1.1700 and 1.1720. USD/CHF declined further and is now struggling below 0.7835.
Important Takeaways for EUR/USD and USD/CHF Analysis Today
· The Euro started a decent increase from

Apple: Earnings Day Above the Activity Zone
On 30 April, after the market close, Apple Inc. will release its financial results for the second quarter of fiscal 2026. The consensus forecast, based on estimates from 31 analysts, points to revenue of around $109.7 billion, with expected

USD/JPY and USD/CHF Near Key Levels: The Dollar Supported by the Fed
The US dollar continues to trend upwards following the Federal Reserve meeting, drawing support from the regulator’s moderately hawkish stance and comments by Jerome Powell. Markets interpret the Fed’s rhetoric as a signal that restrictive policy is likely