Bitcoin Jumps After Brexit
The Brexit related turmoil had a knock-on effect on the crypto market. Prices rose $40 or 6.8 percent on Friday. Since then the gains have petered off with BTC trading in a range for the past few days. A similar pattern was observed for LTC/USD. Here prices jumped 13 percent on Friday before stabilizing somewhat.
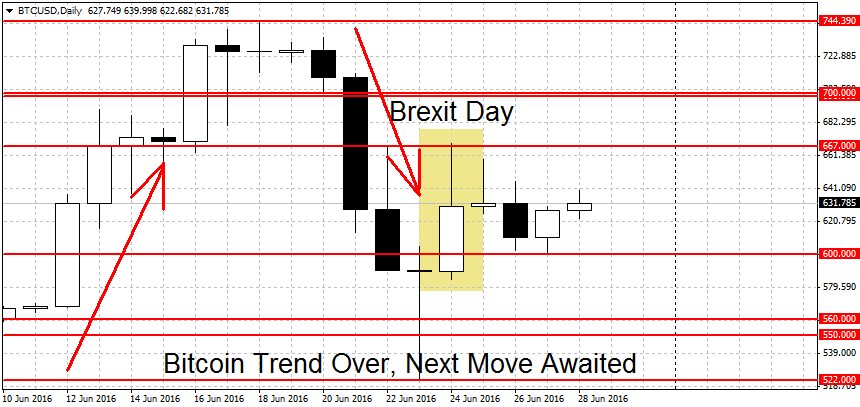
Bitcoin Rallies $40 After Brexit
As we noted above, BTC prices rose by $40 on Friday. Since then, however, the move stalled and we’re currently quoted at $631 per coin.
It’s likely that the jump higher wasn’t directly related to Britain leaving the EU. Brexit has led to major risk-off rally, this in turn has strengthened the U.S. Dollar across the board especially against the emerging market currencies. The Chinese Yuan lost over 2% to USD since late Thursday, from 5.58 to 6.58 right now. The PBOC has so far been reluctant to stop the tide and support its currency, weakening the CNY fixing instead.
But let’s see what the charts are saying. The short-term trend for BTC/USD is neutral. To break this deadlock we need to see a breakout above the highs at $744 on FXOpen ($795 on other USD exchanges). On the lower end, we have major support around $540-$560 per coin on most exchanges and $522 on FXOpen. A decisive break below here could start a new trend lower. Both the medium and long-term trends for Bitcoin are still bullish.
Below $522, a support can be found at the round $500 figure (a weak level) followed by the breakout point for the previous rally at $460 per coin. On the upper end, above $800 we have a cluster of resistance levels at $830, $840 and $850 per coin. More resistance on the upside can be found at the round figures of $900 and $1000.
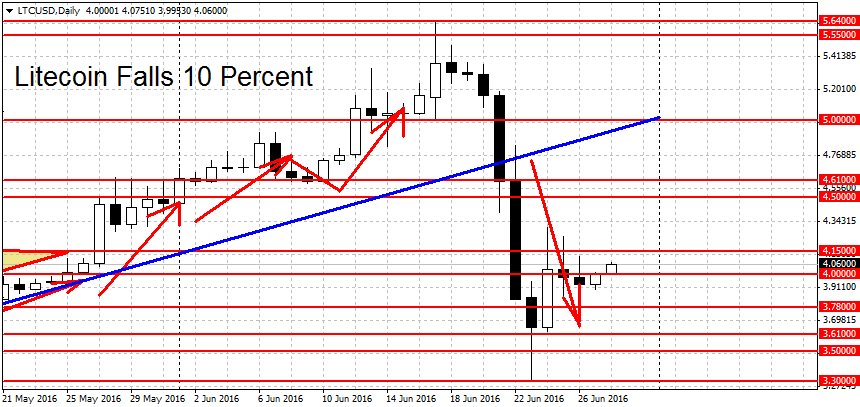
Litecoin Trading 10% Lower
Litecoin is trading 10 percent lower compared to last Tuesday. With the break below $4.15 the altcoin has started a new short-term downtrend. On the longer-term charts, however, things are not that clear. The medium-term trend is still technically bullish while the long-term trend is neutral.
Support levels can be found at the round $4 figure, followed by $3.78. Not far below here we have a support area from $3.50 to $3.61. A break below here could lead to more losses toward $3.30. This figure proved to be an important support level last week with prices bottoming out at $3.31 before slowly clawing back some ground. Below here we have another support at the $3 level. A decisive breakout above $5.50 would end the current downtrend.