Possible Breakout for Bitcoin
After a prolonged period of low volatility and range-bound trading the crypto market rallied yesterday. Bitcoin jumped by $288 dollars to close the day at $6,663 dollars per coin. Litecoin rallied by $3.92 to close at $82.94 dollars yesterday.
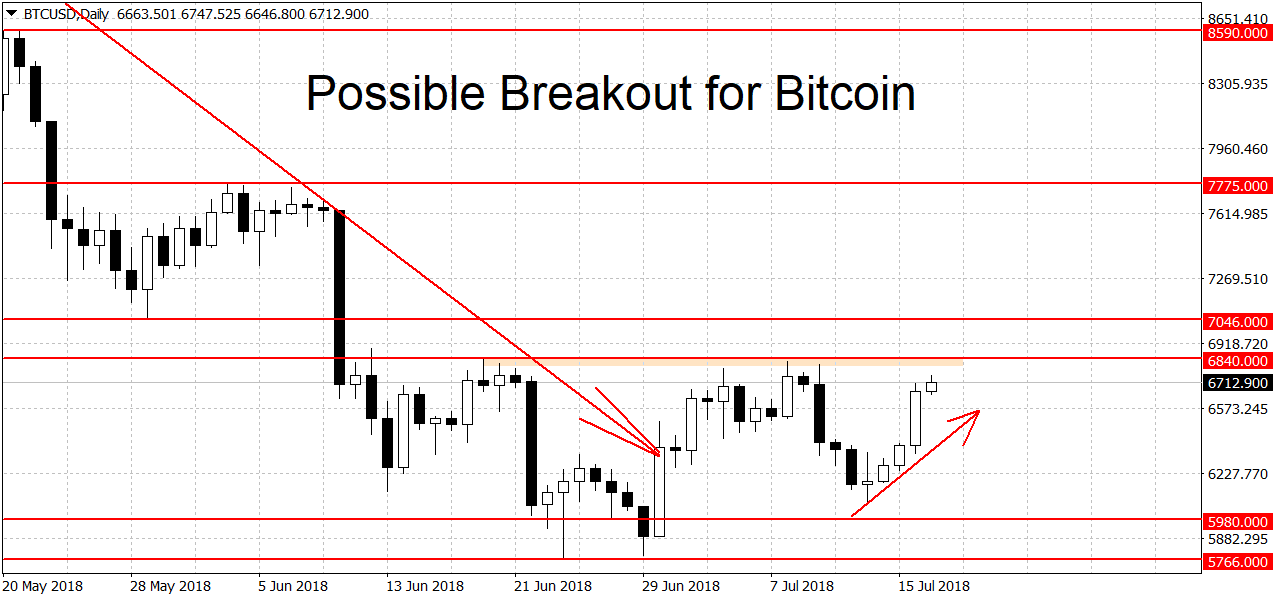
Possible breakout for Bitcoin
Bitcoin finally ended the downtrend started back in May of this year. The crypto rallied by 4.5% yesterday. Today we’re gaining more ground with BTC/USD quoted at $6,712 right now. Bitcoin looks set to test the important resistance at $6,840 dollars per coin. A decisive breakout above here would start a new BTC rally.
Above here there’s weak resistance at the previous swing low of $7,046 dollars. Resistance higher up can be found at the $7,775 swing high. This is followed by more levels at $8,590 and 8,880 dollars. The $10,000 round figure is another notable resistance level. A breakout above here could lead to more gains.
On the lower end the first major support stands at the 2018 low of $5,766 dollars. A break below here would restart the downtrend. Further down we have strong support around the $5,000 round figure. Besides being a major round figure, $5,000 was also a notable 2017 swing high. It’s unlikely that this support will be broken on the first try. If the $5,000 mark breaks the losses could intensify.
On the longer-term charts there’s no change from our last week’s article. The weekly chart is still in a downtrend while the monthlies are holding onto the bullish bias.
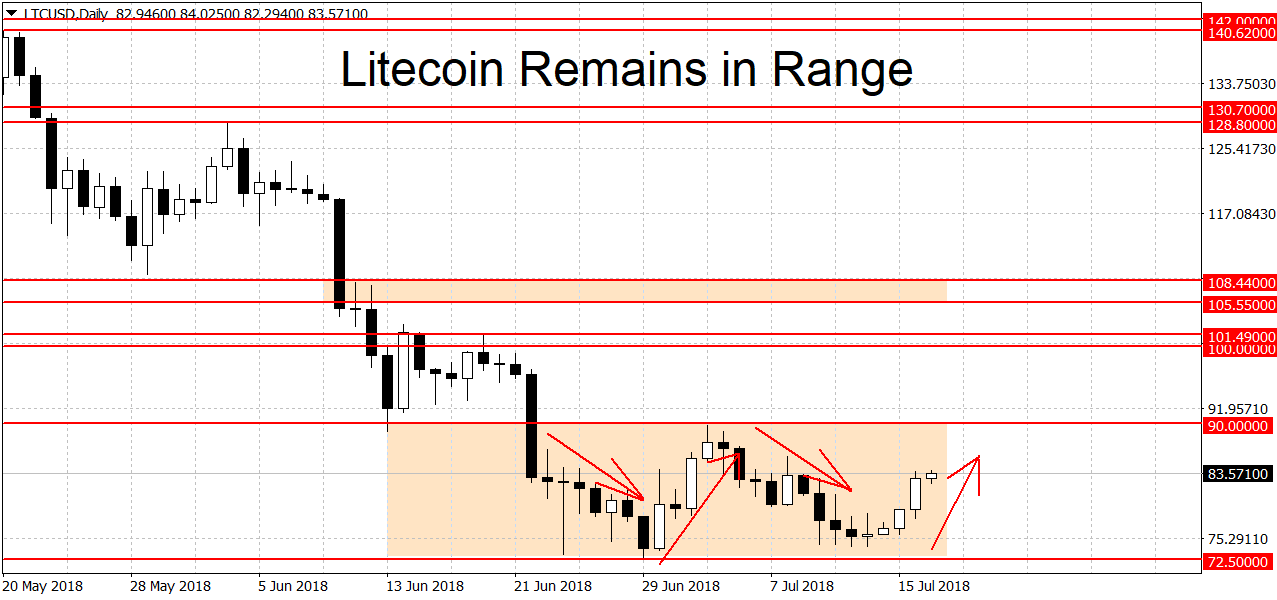
Litecoin Remains in Range
Litecoin continues to trade in a range. The altcoin moved along with the swings in bitcoin but so far hasn’t broken any important price levels. As you can see on the chart below, the price action in LTC/USD has been zig-zaggy all month.
Above we’re looking at the $90 round figure as a potential trend starter. A breakout above could lead to a new LTC rally. Resistance higher up can be found at the $100 round figure followed by $101.49 dollars. Further up we have a strong resistance area in the $105 – $109 range. This was the LTC low for over five months until the June breakdown. A clearing of this resistance area could lead to more gains.
A break below this year’s low at $72.50 dollars could restart the downtrend. The next major level of support is around $50 dollars. Here we have the 2013 high at $48.40 dollars coupled with the $50 round figure. A clean break below $48.40 could lead to more losses. On the longer-term charts the picture is the same as bitcoin, bearish on the weekly but bullish on the monthly charts.
Try crypto trading on FXOpen demo account